Descrizione
PANORAMICA
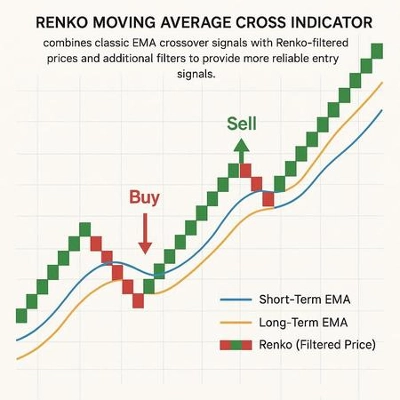
L'indicatore Waddah Attar Explosion (WAE) è stato creato da Ahmad Waddah Attar e introdotto alla comunità di trading nel 2007. Combina la misurazione del momentum MACD con l'analisi della volatilità delle Bande di Bollinger per identificare i momenti di "esplosione del prezzo" — periodi in cui il prezzo passa dalla consolidazione a un forte movimento direzionale.
L'indicatore risponde a due domande:
- Il momentum sta aumentando? (misurato dal tasso di variazione del MACD)
- La volatilità si sta espandendo? (misurata dalla larghezza delle Bande di Bollinger)
Quando entrambe le condizioni si allineano sopra un filtro di rumore (Zona Morta), segnala un potenziale movimento esplosivo.
COMPONENTI
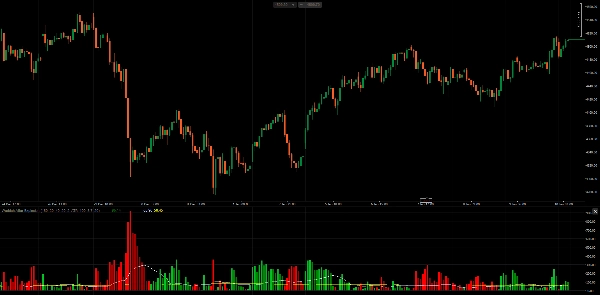
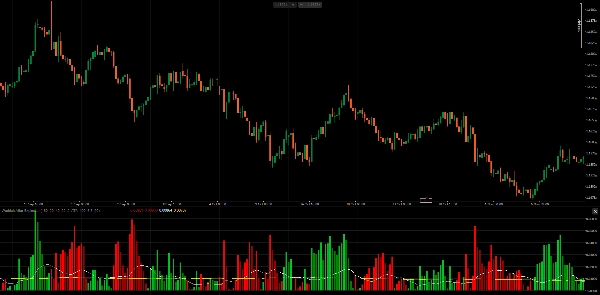
1. Istogramma di Trend (Verde/Rosso) Mostra il tasso di variazione della linea MACD, moltiplicato per un fattore di sensibilità.
- Calcolo:
(MACD_current - MACD_previous) × Sensitivity - Barre verdi: Momentum rialzista (MACD che accelera verso l'alto)
- Barre rosse: Momentum ribassista (MACD che accelera verso il basso)
- Colore chiaro: Momentum in aumento rispetto alla barra precedente
- Colore scuro: Momentum in diminuzione rispetto alla barra precedente
2. Linea di Esplosione (Bianca) Rappresenta la larghezza delle Bande di Bollinger, indicando l'espansione o la contrazione della volatilità.
- Calcolo:
BB_Upper - BB_Lower - In aumento: Volatilità in espansione (potenziale breakout)
- In diminuzione: Volatilità in contrazione (consolidamento)
3. Zona Morta (Gialla) Un filtro soglia per eliminare segnali deboli causati dal rumore di mercato.
- Basata su ATR: Si adatta alla volatilità di mercato corrente
- Pips Fissi: Valore soglia statico
COME AHMAD WADDAH ATTAR LO USA
Secondo l'autore originale:
Regole di Entrata per Acquisto Tutte le condizioni devono essere soddisfatte:
- L'istogramma verde è in aumento
- L'istogramma verde è sopra la Linea di Esplosione
- La Linea di Esplosione è in aumento
- Sia l'istogramma verde che la Linea di Esplosione sono sopra la Zona Morta
Regole di Entrata per Vendita Tutte le condizioni devono essere soddisfatte:
- L'istogramma rosso è in aumento
- L'istogramma rosso è sopra la Linea di Esplosione
- La Linea di Esplosione è in aumento
- Sia l'istogramma rosso che la Linea di Esplosione sono sopra la Zona Morta
Regole di Uscita
- Uscita long quando l'istogramma verde incrocia al di sotto della Linea di Esplosione
- Uscita short quando l'istogramma rosso incrocia al di sotto della Linea di Esplosione
Insight Chiave L'angolo della Linea di Esplosione è importante. Quando la Linea di Esplosione è inclinata verso l'alto e l'istogramma la supera, questo conferma che la volatilità sta aumentando attivamente — l'"esplosione" è reale, non un falso segnale.
PARAMETRI
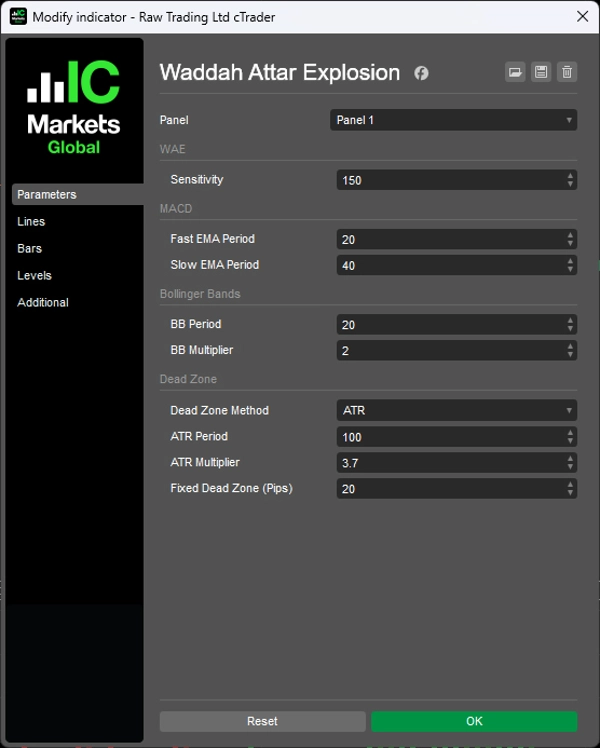
1. Sensibilità
- Sensibilità (150): Moltiplicatore per il tasso di variazione del MACD
2. MACD
- Periodo EMA Veloce (20): Media mobile veloce per il calcolo del MACD
- Periodo EMA Lenta (40): Media mobile lenta per il calcolo del MACD
3. Bande di Bollinger
- Periodo BB (20): Periodo di lookback delle Bande di Bollinger
- Moltiplicatore BB (2.0): Moltiplicatore della deviazione standard
4. Zona Morta
- Metodo Zona Morta (ATR): Scegli tra basato su ATR o Pips Fissi
- Periodo ATR (100): Periodo per il calcolo ATR
- Moltiplicatore ATR (3.7): Moltiplicatore applicato all'ATR per la Zona Morta
- Zona Morta Fissa (20): Valore della Zona Morta in pips (quando si usa il metodo Fisso)
NOTE
- L'indicatore funziona su tutti i timeframe. L'autore originale raccomandava H1 e M30.
- Si consiglia la Zona Morta basata su ATR poiché si adatta a diversi strumenti e condizioni di mercato.
- Il parametro Sensibilità potrebbe necessitare di aggiustamenti in base al timeframe e alla volatilità dello strumento.
- Questo indicatore identifica l'allineamento di momentum e volatilità — non predice la direzione da solo. Considera di usarlo insieme all'analisi del trend o ai livelli di supporto/resistenza.
__________________________________________________________________________________________
ALTRI INDICATORI GRATUITI
Esplora un'ampia gamma di strumenti di analisi di mercato — dalla struttura e volume alla regressione, volatilità e timeframe personalizzati.
Il codice sorgente è disponibile nel repository GitHub.
Tutti gratuiti da usare. Ma se vuoi offrire un supporto per un caffè, puoi farlo qui.
Supporto/Resistenza
Volume
- Volume Activity Profiler
- Volume Efficiency Analyzer
- Volume Profile Analytics
- Volume Profile - Aggiornato
- Volume Spread Analysis
- VWAP (Prezzo Medio Ponderato per Volume)
Medie Mobili
- SSL Channel
- Media Mobile Ancorata
- Media Mobile Scalata per Deviazione
- Gann High Low Activator
- Linea di Tendenza Istantanea
- Media Mobile Adattiva di Kaufman con Visione del Trend
- Canale Media Mobile
- Suite Medie Mobili
- Media Mobile Canale Trend
Utilità/Personalizzati
Basati su Regressione
Volatilità
Oscillatori
__________________________________________________________________________________________
DICHIARAZIONE DI NON RESPONSABILITÀ
Il trading comporta rischi. Questo indicatore è destinato solo all'analisi tecnica — applica sempre una corretta gestione del rischio e opera responsabilmente.
FEEDBACK E MIGLIORAMENTI
Se hai suggerimenti, richieste di funzionalità o idee per miglioramenti, lascia un commento nella scheda Discussione. Il tuo feedback aiuta a migliorare l'indicatore per tutti.