
Opis
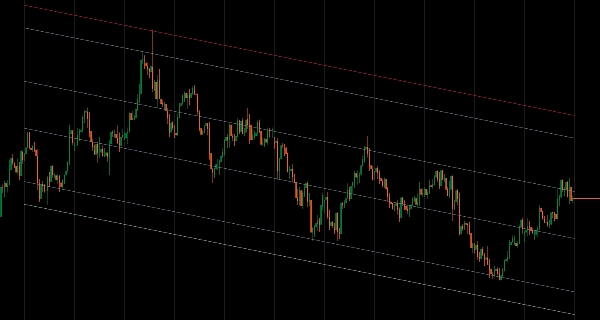
Statystyczne kanały cenowe z elastycznymi trybami obliczeń i renderowaniem pasm opartym na odchyleniach.
Dopasowuje linie regresji do danych cenowych, korzystając z trybu okresu (ostatnie N świec), trybu daty i czasu (od określonych dat) lub mechanizmu blokady, aby zamrozić analizę w historycznych punktach, podczas gdy cena nadal się zmienia.
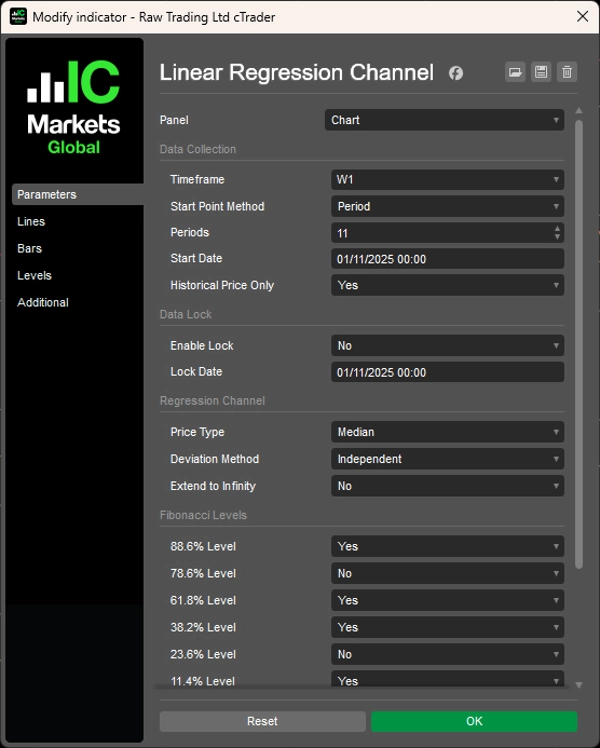
Trzy metody odchylenia (średnie, niezależne, maksymalne) dla symetrycznych i asymetrycznych kanałów, sześć poziomów zniesień Fibonacciego (od 11,4% do 88,6%), analiza wielookresowa, sześć typów cen (otwarcie/maksimum/minimum/zamknięcie/mediana/typowa), tryb tylko historyczny dla stabilnego testowania wstecznego oraz projekcja na nieskończoność zapewniają kompleksową analizę regresji dla traderów celujących w strefy powrotu do średniej i statystyczne granice cenowe w różnych warunkach rynkowych.
CECHY
Elastyczny wybór danych
- Tryb okresu: Analiza ostatnich N świec (np. ostatnich 12 miesięcznych świec)
- Tryb daty i czasu: Start od określonych wydarzeń rynkowych lub dat
- Mechanizm blokady: Zamrożenie analizy w historycznym punkcie, podczas gdy cena nadal się zmienia
- Wielookresowość: Rysowanie regresji z dowolnego interwału na aktualnym wykresie
Inteligentne metody odchylenia
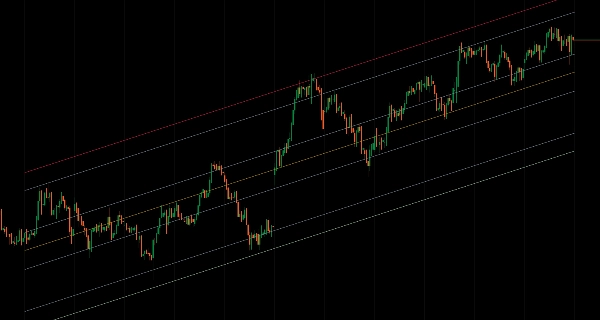
- Średnie: Zrównoważone poziomy wykorzystujące średnie odchylenia — idealne dla stref handlowych
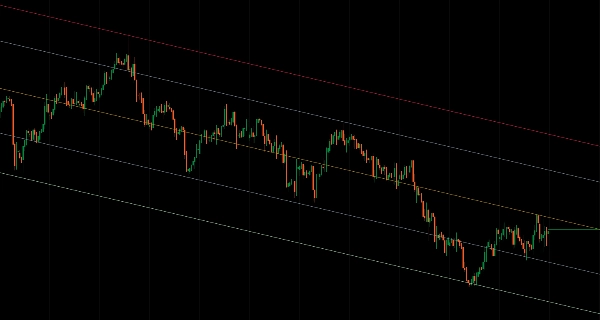
- Niezależne: Asymetryczne kanały dostosowujące się do kierunkowej zmienności
- Maksymalne: Pokazuje ekstremalne granice cen dla pełnej analizy zakresu
Profesjonalne narzędzia analityczne
- 6 poziomów zniesień Fibonacciego (11,4%, 23,6%, 38,2%, 61,8%, 78,6%, 88,6%)
- 6 typów cen: otwarcie, maksimum, minimum, zamknięcie, mediana, typowa
- Tryb tylko historyczny: wyklucza formujące się świece dla stabilnego testowania wstecznego
- Opcja rozszerzenia na nieskończoność dla długoterminowych projekcji
Pełna personalizacja
- Pełna personalizacja kolorów wszystkich elementów kanału
- Niezależna kontrola nad linią regresji i pasmami odchylenia
- Czysta prezentacja wizualna dla skoncentrowanej analizy
Zaawansowane możliwości
- Funkcja blokady dla analiz opartych na wydarzeniach
- Łączenie struktury wyższego interwału z wykonaniem na niższym interwale
- Opcje symetrycznych i asymetrycznych kanałów dla różnych warunków rynkowych
__________________________________________________________________________________________
WIĘCEJ DARMOWYCH WSKAŹNIKÓW
Odkryj szeroki zakres narzędzi analizy rynku — od struktury i wolumenu po regresję, zmienność i niestandardowe interwały czasowe.
Kod źródłowy jest dostępny w repozytorium GitHub repository.
Wszystko do darmowego użytku. Ale jeśli chcesz wysłać wsparcie na kawę, możesz to zrobić tutaj.
Wsparcie/Oporność
Wolumen
- Volume Activity Profiler
- Volume Efficiency Analyzer
- Volume Profile Analytics
- Volume Profile - Updated
- Volume Spread Analysis
- VWAP (Volume Weighted Average Price)
Średnie kroczące
- SSL Channel
- Anchored Moving Average
- Deviation-Scaled Moving Average
- Gann High Low Activator
- Instantaneous Trendline
- Kaufman Adaptive MA with Trend Vision
- Moving Average Channel
- Moving Averages Suite
- Trend Channel Moving Average
Narzędzia/niestandardowe
Oparte na regresji
Zmienność
Oscylatory
__________________________________________________________________________________________
ZASTRZEŻENIE
Trading wiąże się z ryzykiem. Ten wskaźnik jest przeznaczony wyłącznie do analizy technicznej — zawsze stosuj odpowiednie zarządzanie ryzykiem i handluj odpowiedzialnie.
OPINIE I ULEPSZENIA
Jeśli masz sugestie, prośby o funkcje lub pomysły na ulepszenia, zostaw komentarz na karcie Dyskusja. Twoja opinia pomaga ulepszyć wskaźnik dla wszystkich.
Podsumowanie
Opinie klientów
5 | 100 % | |
4 | 0 % | |
3 | 0 % | |
2 | 0 % | |
1 | 0 % |


