
คำอธิบาย
ภาพรวม
Volume Spread Analysis (VSA) คือวิธีการที่พัฒนาโดย Tom Williams อดีตเทรดเดอร์ซินดิเคท โดยอิงจากงานของ Richard Wyckoff ในช่วงต้นทศวรรษ 1900 VSA วิเคราะห์ความสัมพันธ์ระหว่างปริมาณการซื้อขาย ช่วงราคาที่เคลื่อนไหว (range) และตำแหน่งปิดเพื่อระบุความไม่สมดุลของอุปสงค์และอุปทาน
แนวคิดสำคัญของ VSA:
- ปริมาณ แสดงปริมาณกิจกรรม - ใครเป็นผู้เข้าร่วม
- ช่วงราคา แสดงความผันผวนและความไม่แน่นอน - ราคาขยับไปไกลแค่ไหน
- ตำแหน่งปิด แสดงว่าใครชนะในแท่งนั้น - ผู้ซื้อหรือผู้ขาย
- บริบท แสดงว่าเราอยู่ในวัฏจักรตลาดส่วนใด - ช่วงแข็งแกร่งหรืออ่อนแอ
เมื่อปริมาณเพิ่มขึ้นพร้อมกับช่วงกว้างแต่ราคาก้าวหน้าเล็กน้อย แสดงถึงการดูดซับ (ฝ่ายหนึ่งดูดซับแรงกดดันของอีกฝ่าย) เมื่อปริมาณลดลงพร้อมช่วงแคบในแนวโน้ม แสดงถึงการขาดการมีส่วนร่วม (อาจเป็นความอ่อนแอ)
การใช้งานนี้:
ตัวบ่งชี้นี้วัดแนวคิด VSA โดยใช้วิธีทางสถิติ แตกต่างจาก VSA แบบดั้งเดิมในหลายประการ:
- ใช้
(close - open) / rangeเป็นตัวชี้วัดประสิทธิภาพ (ไม่มีใน VSA ดั้งเดิม) - รูปแบบการดูดซับระบุว่า "ฝ่ายใดฝ่ายหนึ่งชนะ" แทนที่จะเป็น "การดูดซับแรงกดดัน" แบบดั้งเดิม
- ENR (Effort No Result) ถูกวัดโดยใช้เกณฑ์ประสิทธิภาพ; VSA ดั้งเดิมเน้นการตีความมากกว่า
- ใช้ค่าเฉลี่ย trimmed mean สำหรับการเฉลี่ยปริมาณ (ต้านทานค่าผิดปกติ) และการจัดอันดับเปอร์เซ็นไทล์สำหรับช่วงราคา
- ไม่รวม: รูปแบบ Stopping Volume, Upthrust, Test, Shakeout
นี่คือวิธีการเชิงปริมาณและอัลกอริทึมสำหรับแนวคิด VSA VSA แบบดั้งเดิมเน้นการตีความและขึ้นอยู่กับบริบท ใช้ตัวบ่งชี้นี้เป็นเครื่องมือวิเคราะห์หนึ่งในหลายๆ ตัว ไม่ใช่สัญญาณเดี่ยว
สิ่งที่ตัวบ่งชี้นี้ทำ
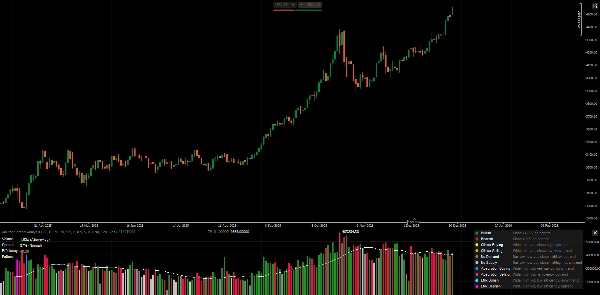
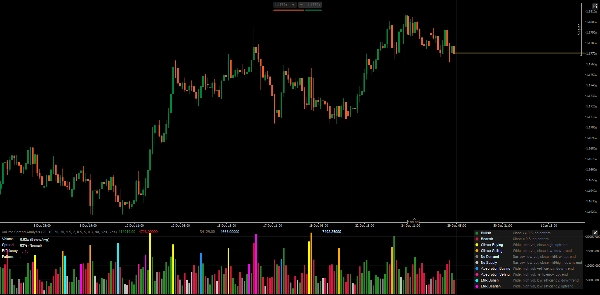
วิเคราะห์ปริมาณ ช่วงราคา และตำแหน่งปิดของแต่ละแท่งเพื่อค้นหาความไม่สมดุลของอุปสงค์/อุปทานที่อาจเกิดขึ้น แสดงฮิสโตแกรมปริมาณที่ระบายสีตามประเภทของรูปแบบ พร้อมแผงแสดงเมตริกแบบเรียลไทม์
คำจำกัดความของรูปแบบ
1. แท่งมาตรฐาน (ไม่มีรูปแบบ)
- กระทิง: ปิด ≥ 0.5 ในช่วงราคา ไม่มีรูปแบบพิเศษตรวจพบ
- หมี: ปิด < 0.5 ในช่วงราคา ไม่มีรูปแบบพิเศษตรวจพบ
2. รูปแบบ Climax (อาจเป็นการหมดแรง)
- Climax Buying: ช่วงกว้าง + ปริมาณสูงมาก + ปิดสูง + ในแนวโน้มขาขึ้น
-
- การตีความ: อาจเป็นการหมดแรงซื้อ รอดูการกลับตัว
- Climax Selling: ช่วงกว้าง + ปริมาณสูงมาก + ปิดต่ำ + ในแนวโน้มขาลง
-
- การตีความ: อาจเป็นการหมดแรงขาย รอดูการกลับตัว
3. รูปแบบอ่อนแอ (ขาดความมั่นใจ)
- ไม่มีความต้องการ: ช่วงแคบ + ปริมาณต่ำ + ปิดกลาง/ต่ำ + ในแนวโน้มขาขึ้น
-
- การตีความ: ผู้ซื้อไม่สนับสนุนการขึ้นราคา อาจเป็นความอ่อนแอ
- ไม่มีอุปทาน: ช่วงแคบ + ปริมาณต่ำ + ปิดกลาง/สูง + ในแนวโน้มขาลง
-
- การตีความ: ผู้ขายไม่ผลักดันราคาลง อาจเป็นความแข็งแกร่ง
4. รูปแบบการดูดซับ (ฝ่ายใดฝ่ายหนึ่งชนะ)
- Absorption Buying: ช่วงกว้าง + ปริมาณสูง + ประสิทธิภาพบวก + ในแนวโน้มขาลง
-
- การตีความ: ผู้ซื้อดูดซับแรงกดดันจากผู้ขาย อาจเกิดการกลับตัวขึ้น
- Absorption Selling: ช่วงกว้าง + ปริมาณสูง + ประสิทธิภาพลบ + ในแนวโน้มขาขึ้น
-
- การตีความ: ผู้ขายดูดซับแรงกดดันจากผู้ซื้อ อาจเกิดการกลับตัวลง
5. รูปแบบ ENR (ความพยายามโดยไม่มีผลลัพธ์ชัดเจน)
- ENR กระทิง: ช่วงกว้าง + ปริมาณสูง + ประสิทธิภาพต่ำ + ในแนวโน้มขาลง
-
- การตีความ: ความพยายามสูงแต่ไม่มีผู้ชนะชัดเจน อาจเป็นการสนับสนุน/ไม่แน่นอน
- ENR หมี: ช่วงกว้าง + ปริมาณสูง + ประสิทธิภาพต่ำ + ในแนวโน้มขาขึ้น
-
- การตีความ: ความพยายามสูงแต่ไม่มีผู้ชนะชัดเจน อาจเป็นการต้านทาน/ไม่แน่นอน
แผงเมตริกอธิบาย
ปริมาณ
- แสดงปริมาณแท่งปัจจุบันเป็นอัตราส่วนกับ trimmed mean (เช่น "1.85x")
- การจำแนก: ต่ำ / ต่ำกว่าค่าเฉลี่ย / สูงกว่าค่าเฉลี่ย / สูง / สูงมาก
- ปริมาณสูง = การมีส่วนร่วมของตลาด แต่บริบทสำคัญ
ช่วงราคา
- แสดงอันดับเปอร์เซ็นไทล์ (0-100%) เทียบกับแท่งล่าสุด
- การจำแนก: แคบ / ปกติ / กว้าง
- ช่วงกว้าง = ความผันผวน/ความไม่แน่นอน ไม่จำเป็นต้องบ่งชี้ทิศทาง
ประสิทธิภาพ
- สูตร:
(close - open) / (high - low) - ช่วง: -1.0 ถึง +1.0
- บวก = ตัวแทนกระทิงครอบงำช่วงราคา
- ลบ = ตัวแทนหมีครอบงำช่วงราคา
- ใกล้ศูนย์ = ตัวแทนขนาดเล็ก ไส้เทียนสูง ไม่แน่นอน
รูปแบบ
- รูปแบบที่ตรวจพบปัจจุบัน (หรือ "-" หากไม่มี)
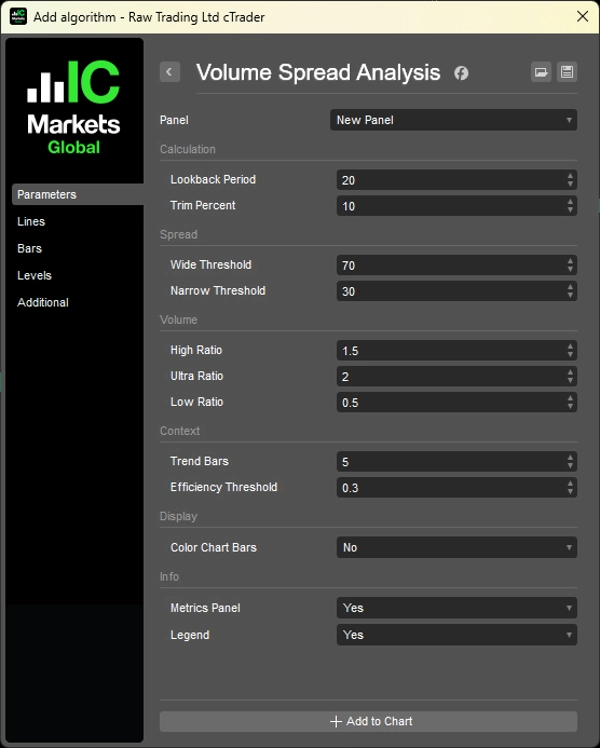
พารามิเตอร์
1. การคำนวณ
- ช่วงเวลาย้อนหลัง (20): จำนวนแท่งที่ใช้สำหรับสถิติปริมาณ/ช่วงราคา
- เปอร์เซ็นต์ตัดแต่ง (10%): ลบค่าผิดปกติออกจากการคำนวณปริมาณ
2. การจำแนกช่วงราคา
- เกณฑ์กว้าง (70%): เปอร์เซ็นไทล์สำหรับจำแนกเป็น "กว้าง"
- เกณฑ์แคบ (30%): เปอร์เซ็นไทล์สำหรับจำแนกเป็น "แคบ"
3. การจำแนกปริมาณ
- อัตราส่วนสูง (1.5x): เกณฑ์สูงกว่าค่าเฉลี่ย
- อัตราส่วนสูงมาก (2.0x): เกณฑ์สูงมาก
- อัตราส่วนต่ำ (0.5x): เกณฑ์ต่ำกว่าค่าเฉลี่ย
4. บริบท
- แท่งแนวโน้ม (5): จำนวนแท่งย้อนหลังเพื่อเปรียบเทียบทิศทางแนวโน้ม
- เกณฑ์ประสิทธิภาพ (0.3): ค่าขั้นต่ำสำหรับประสิทธิภาพ "แข็งแกร่ง"
5. การแสดงผล
- แท่งกราฟสี: ใช้สีรูปแบบกับกราฟราคา
- แผงเมตริก: แสดงเมตริกแบบเรียลไทม์
- คำอธิบาย: แสดงคู่มืออ้างอิงรูปแบบ
วิธีใช้
1. อย่าใช้รูปแบบเป็นสัญญาณซื้อขายโดยตรง - รูปแบบบ่งชี้บริบทที่เป็นไปได้ ไม่ใช่จุดเข้า
2. รวมกับโครงสร้างราคา - VSA ทำงานได้ดีที่สุดเมื่อยืนยันสิ่งที่โครงสร้างราคาบอก
3. สังเกตบริบท - รูปแบบเดียวกันอาจหมายถึงสิ่งต่างกันที่แนวรับกับแนวต้าน
4. มุมมองปริมาณสำคัญ - การดูดซับปริมาณสูงที่ระดับสำคัญ > การดูดซับแท่งสุ่ม
ข้อจำกัดของปริมาณ Forex
ตลาด Forex spot แสดง tick volume (จำนวนการเปลี่ยนแปลงราคา) ไม่ใช่สัญญาที่ซื้อขายจริง รูปแบบอาจน่าเชื่อถือน้อยกว่าตลาดฟิวเจอร์ส/หุ้นที่มีข้อมูลปริมาณจริง
คำอธิบาย (อ้างอิงในตัว)
เปิดใช้งานพารามิเตอร์ "คำอธิบาย" เพื่อแสดงคำอธิบายรูปแบบโดยตรงบนกราฟ
__________________________________________________________________________________________
ตัวบ่งชี้ฟรีเพิ่มเติม
สำรวจเครื่องมือวิเคราะห์ตลาดหลากหลายประเภท — ตั้งแต่โครงสร้างและปริมาณไปจนถึงการถดถอย ความผันผวน และกรอบเวลาที่กำหนดเอง
ซอร์สโค้ดมีให้บน GitHub repository.
ทั้งหมดใช้ฟรี แต่ถ้าคุณต้องการสนับสนุนด้วยกาแฟ คุณสามารถส่งได้ที่ ที่นี่.
แนวรับ/แนวต้าน
ปริมาณ
- Volume Activity Profiler
- Volume Efficiency Analyzer
- Volume Profile Analytics
- Volume Profile - Updated
- Volume Spread Analysis
- VWAP (Volume Weighted Average Price)
ค่าเฉลี่ยเคลื่อนที่
- SSL Channel
- Anchored Moving Average
- Deviation-Scaled Moving Average
- Gann High Low Activator
- Instantaneous Trendline
- Kaufman Adaptive MA with Trend Vision
- Moving Average Channel
- Moving Averages Suite
- Trend Channel Moving Average
ยูทิลิตี้/กำหนดเอง
แบบถดถอย
ความผันผวน
ออสซิลเลเตอร์
__________________________________________________________________________________________
ข้อจำกัดความรับผิดชอบ
การเทรดมีความเสี่ยง ตัวบ่งชี้นี้มีไว้สำหรับการวิเคราะห์ทางเทคนิคเท่านั้น — โปรดใช้การจัดการความเสี่ยงอย่างเหมาะสมและเทรดอย่างรับผิดชอบเสมอ
คำติชม & การปรับปรุง
หากคุณมีข้อเสนอแนะ คำขอฟีเจอร์ หรือไอเดียสำหรับการปรับปรุง โปรดแสดงความคิดเห็นในแท็บ Discussion คำติชมของคุณช่วยพัฒนาตัวบ่งชี้ให้ดียิ่งขึ้นสำหรับทุกคน
สรุป
This implementation quantifies VSA concepts using statistical methods, including an efficiency metric defined as (close - open) / range, trimmed mean volume averaging, and percentile ranking for spread. It identifies several bar patterns: Standard (bullish/bearish), Climax (buying/selling exhaustion), Weak (No Demand/No Supply), Absorption (one side winning), and ENR (Effort No Result), each indicating different market conditions.
The indicator displays a volume histogram colored by detected pattern type and provides a real-time metrics panel showing volume ratio, spread percentile, efficiency, and current pattern. Parameters allow customization of lookback periods, volume/spread thresholds, and display options such as coloring chart bars and showing a pattern legend.
VSA is applicable across markets including Forex, stocks, indices, commodities, and crypto. Note that Forex volume reflects tick volume, which may affect pattern reliability. The indicator is designed as an analytical tool to complement price structure analysis rather than as standalone trade signals.
รีวิวจากลูกค้า
5 | 100 % | |
4 | 0 % | |
3 | 0 % | |
2 | 0 % | |
1 | 0 % |


!["[Stellar Strategies] Inside Bar with Signals" โลโก้](https://cdn.ctrader.com/image/webp/1d9e8bfa-3b2c-4440-bb37-5856902008a7_30683)
