Beschreibung
WICHTIGE HINWEISE - ZUERST LESEN
Forex-Volumen ist kein echtes Volumen
Volumen im Forex ist Tick-Volumen – es zählt, wie oft sich der Preis ändert. Es zählt NICHT, wie viel Geld gehandelt wurde.
Was Tick-Volumen nicht zeigen kann
- Handelsgröße. Ein $100 Trade und ein $10.000.000 Trade zählen beide als 1 Tick.
- Echter Geldfluss. Sie können nicht sehen, ob großes oder kleines Geld den Preis bewegt hat.
- Wahre Liquidität. Sie können nicht sehen, wie viele Aufträge im Markt warten.
- Bankaktivität. Banken sehen echte Volumendaten. Sie nicht.
Was das bedeutet
Tick-Volumen zeigt nur, wie oft sich der Preis geändert hat – nicht das dahinterstehende Geld. Das führt zu Problemen:
- Sie können Banken oder Institutionen nicht verfolgen. Sie verwenden echte Volumendaten, auf die Sie keinen Zugriff haben.
- Sie können "Smart Money"-Theorien nicht beweisen. Diese Ideen benötigen echtes Volumen, nicht Tick-Zählungen.
- Sie können wahre Liquidität nicht beurteilen. Tick-Aktivität zeigt keine Auftrags-Tiefe oder echte Marktstärke.
- Sie können echte Kauf- oder Verkaufskraft nicht messen. Viele kleine Trades sehen gleich aus wie ein großer institutioneller Trade.
- Volumenspitzen können täuschen. Eine Spitze kann nur algorithmisches Rauschen sein, kein echtes Handelsinteresse.
Wie man diesen Indikator richtig verwendet
- Behandeln Sie ihn als Aktivitätsmesser, nicht als Geldmesser. Hohes Tick-Volumen = Markt ist beschäftigt. Niedriges Tick-Volumen = Markt ist ruhig. Nicht mehr.
- Vergleichen Sie die Aktivität zu verschiedenen Zeiten. Nutzen Sie ihn, um zu sehen: Ist die London-Session geschäftiger als New York? Ist heute aktiver als gestern? Ist die Trendperiode geschäftiger als die Konsolidierung?
- Kombinieren Sie ihn mit der Preisstruktur. Verwenden Sie Unterstützung/Widerstand, Swing-Punkte oder BOS/ChoCH zusammen mit Volumen. Der Preiskontext verhindert falsche Signale durch laute Volumenspitzen.
- Beobachten Sie die Aktivität bei wichtigen Preisniveaus. Wenn der Preis ein Schlüssel-Level testet und das Tick-Volumen steigt, bedeutet das, dass mehr Trader aktiv sind. Es bedeutet NICHT, dass große Akteure beteiligt sind.
- Gehen Sie nicht davon aus, dass es institutionelle Aktivität zeigt. Tick-Volumen kann keine Akkumulation, große Aufträge oder "Smart Money" zeigen. Verwenden Sie es nur, um Rhythmus und Tempo zu messen.
__________________________________________________________________________________________
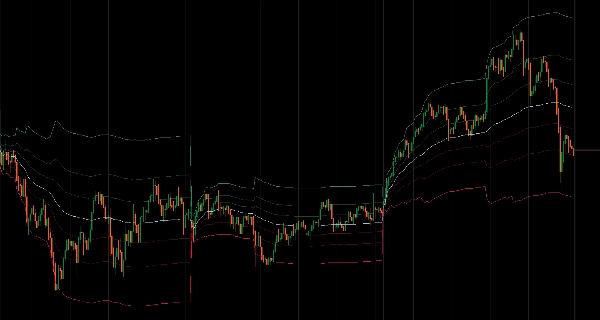
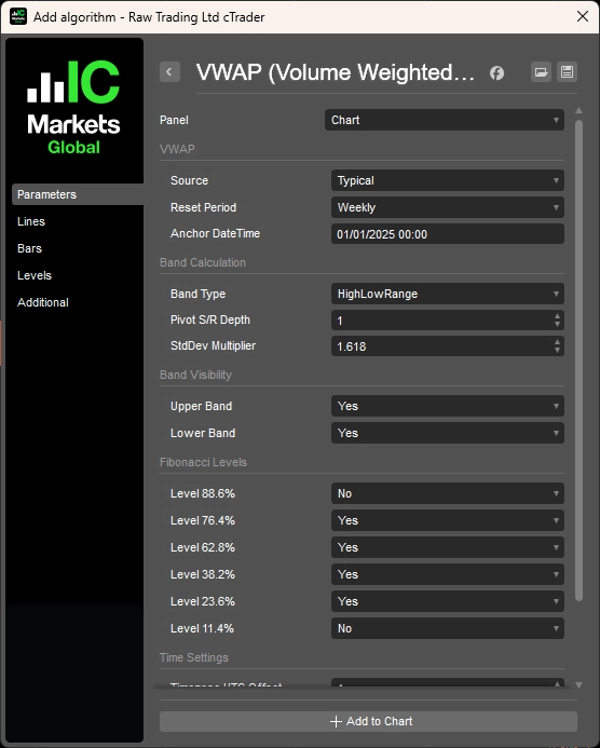
Volumen-Gewichteter Durchschnittspreis mit flexiblen Reset-Perioden und drei Band-Berechnungsmethoden.
Berechnet den volumen-gewichteten Durchschnittspreis mit flexiblen Reset-Perioden, einschließlich zeitbasierter Intervalle (täglich, wöchentlich, monatlich, jährlich oder benutzerdefinierte stündliche Intervalle), sitzungsbasierte Resets (Asien, London, New York mit konfigurierbaren Startzeiten), Ankerpunktmodus zum Festpinnen des VWAP auf bestimmte Ereignisse oder rollierende Berechnung aus allen verfügbaren Daten.
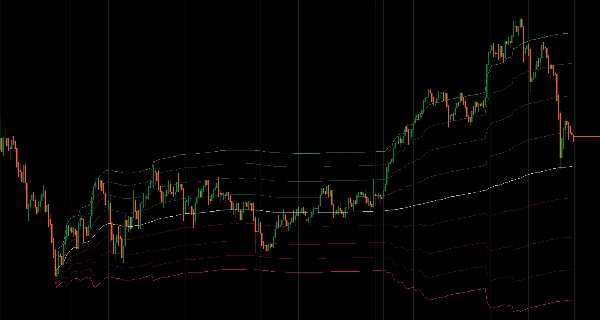
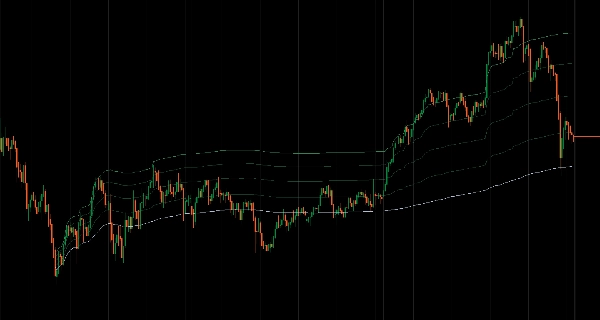
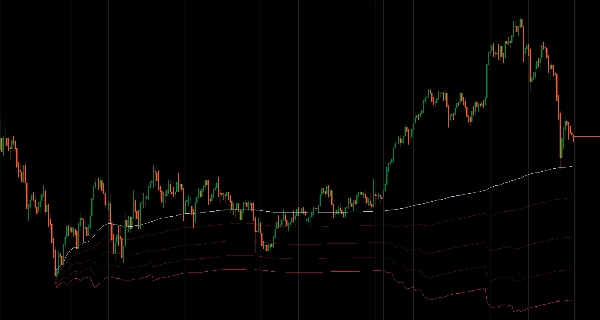
Es bietet drei Band-Berechnungsmethoden: Hoch/Tief-Bereich basierend auf der Preisspanne der vorherigen Periode, Fibonacci Pivot mit klassischen Pivot-Berechnungen und Standardabweichungsbänder, die sich mit der Volatilität ausdehnen und zusammenziehen.
Sie können acht Fibonacci-Level (100 %, 88,6 %, 76,4 %, 62,8 %, 50 %, 38,2 %, 23,6 %, 11,4 %, 0 %) mit individuellen Sichtbarkeitsschaltern und schnellen Gruppensteuerungen für obere/untere Bänder anpassen. Das Sitzungsmanagement umfasst exakte Startzeitkonfiguration mit UTC-Offset-Anpassung und zeitzonenbewusste stündliche Reset-Verarbeitung.
EIGENSCHAFTEN
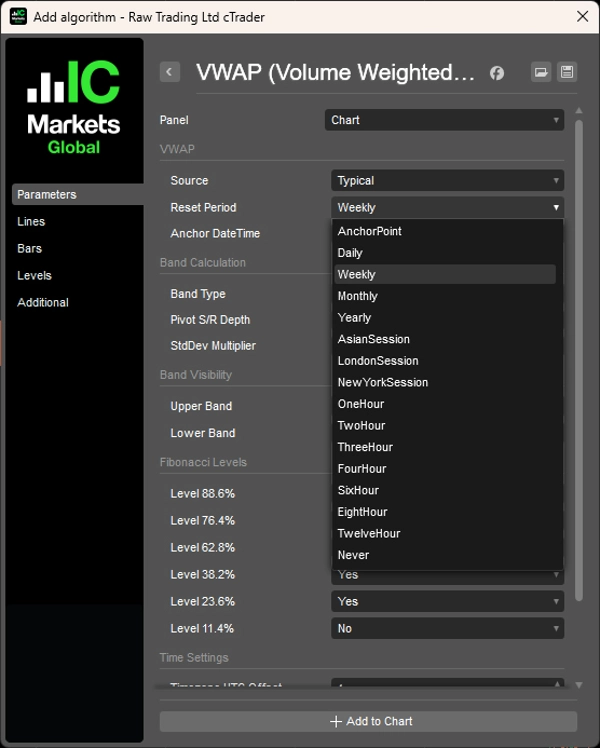
- Flexible Reset-Perioden
-
- Zeitbasiert: Täglich, Wöchentlich, Monatlich, Jährlich oder benutzerdefinierte stündliche Intervalle (1H, 2H, 3H, 4H, 6H, 8H, 12H)
- Sitzungsbasiert: Asien-, London-, New York-Sitzungen mit konfigurierbaren Startzeiten und Zeitzonen-Offsets
- Ankerpunkt: VWAP an ein beliebiges Datum/Uhrzeit für ereignisgesteuerte Analyse anheften
- Rollierend: Berechnung aus allen verfügbaren Daten ohne Reset
- Drei Band-Berechnungsmethoden
-
- Hoch/Tief-Bereich: Bänder basierend auf der Preisspanne der vorherigen Periode
- Fibonacci Pivot: Klassische Pivot-Punkt-Berechnung aus H/L/C der vorherigen Periode
- Standardabweichung: Traditionelle statistische Bänder, die sich mit der Volatilität ausdehnen/zusammenziehen
- Vollständige Kontrolle der Fibonacci-Level
-
- 8 anpassbare Level: 100 %, 88,6 %, 76,4 %, 62,8 %, 50 % (VWAP), 38,2 %, 23,6 %, 11,4 %, 0 %
- Individuelle Sichtbarkeitsschalter für Level
- Gruppensteuerungen für obere/untere Bänder zur schnellen Anpassung
- Sitzungsmanagement
-
- Exakte Sitzungsstartzeiten mit UTC-Offset-Anpassung konfigurieren (-12 bis +14 Stunden)
- Visuelle Sitzungsinfo zeigt aktuellen Reset-Zeitplan
- Zeitzonenbewusste stündliche Reset-Verarbeitung
- Leistungsoptimiert
-
- Lazy-Berechnung – Bänder werden nur berechnet, wenn sie sichtbar sind
- Intelligentes Caching und Batch-Verarbeitung
- Minimaler CPU-Einfluss, selbst wenn alle Level aktiviert sind
__________________________________________________________________________________________
MEHR KOSTENLOSE INDIKATOREN
Entdecken Sie eine breite Palette von Marktanalysetools – von Struktur und Volumen bis Regression, Volatilität und benutzerdefinierten Zeitrahmen.
Der Quellcode ist auf GitHub Repository verfügbar.
Alle kostenlos nutzbar. Wenn Sie jedoch Kaffee-Unterstützung senden möchten, können Sie sie hierhinleiten.
Unterstützung/Widerstand
Volumen
- Volumen-Aktivitätsprofiler
- Volumen-Effizienz-Analysator
- Volumenprofil-Analytik
- Volumenprofil - Aktualisiert
- Volumen-Spread-Analyse
- VWAP (Volumen-Gewichteter Durchschnittspreis)
Gleitende Durchschnitte
- SSL-Kanal
- Anker-Gleitender Durchschnitt
- Abweichungsskaliertes Gleitender Durchschnitt
- Gann Hoch-Tief-Aktivator
- Instantane Trendlinie
- Kaufman Adaptiver GD mit Trend Vision
- Gleitender Durchschnittskanal
- Gleitende Durchschnitte Suite
- Trendkanal Gleitender Durchschnitt
Dienstprogramme/Benutzerdefiniert
Regressionsbasiert
Volatilität
Oszillatoren
__________________________________________________________________________________________
HAFTUNGSAUSSCHLUSS
Trading beinhaltet Risiken. Dieser Indikator ist nur für die technische Analyse gedacht – wenden Sie stets ein angemessenes Risikomanagement an und handeln Sie verantwortungsbewusst.
FEEDBACK & VERBESSERUNGEN
Wenn Sie Vorschläge, Funktionswünsche oder Ideen zur Verbesserung haben, hinterlassen Sie bitte einen Kommentar im Diskussions-Tab. Ihr Feedback hilft, den Indikator für alle zu verbessern.
Zusammenfassung
The indicator offers three band calculation methods: High/Low Range bands based on the previous period's price range, Fibonacci Pivot bands using classical pivot calculations, and Standard Deviation bands that adjust with market volatility. Users can customize eight Fibonacci levels (ranging from 0% to 100%) with individual visibility toggles and group controls for upper and lower bands.
Session management features include precise start time configuration with UTC offset adjustments and timezone-aware hourly resets, along with visual session information display. Performance optimizations include lazy calculation of bands only when visible, intelligent caching, and batch processing to minimize CPU usage.
Note: For forex markets, volume data represents tick volume (price change counts) rather than actual traded volume, so this indicator should be used as a measure of market activity rather than real money flow. It is intended for technical analysis with proper risk management.
Kundenbewertungen
5 | 100 % | |
4 | 0 % | |
3 | 0 % | |
2 | 0 % | |
1 | 0 % |