
설명
개요
즉시 추세선은 전기 엔지니어인 John Ehlers가 개발한 기술 지표로, 디지털 신호 처리(DSP) 원리를 금융 시장 분석에 적용했습니다. 원래 Stocks & Commodities 잡지(2002년 2월호)에 발표되었으며, 그의 저서 "Rocket Science for Traders"와 "Cybernetic Analysis for Stocks and Futures"에 자세히 설명되어 있습니다. 이 지표는 가격 데이터의 추세 성분을 주기적(진동하는) 성분을 걸러내어 분리합니다.
개념
단순히 가격 데이터를 부드럽게 처리하는 전통적인 이동평균과 달리, 즉시 추세선은 전기공학에서 파생된 수학적 기법을 사용하여 가격 움직임을 두 가지 뚜렷한 성분으로 분해합니다:
- 추세 성분 - 시장의 방향성 편향
- 주기 성분 - 추세를 중심으로 한 진동 변동
노치 필터와 힐버트 변환 방법론을 적용하여, Ehlers는 진정한 추세 변화에 빠르게 반응하면서 잡음과 단기 주기를 걸러내는 지표를 만들었습니다. 그 결과, 단순 또는 지수 이동평균과 비교해 지연이 크게 줄어든 시장 상황에 적응하는 추세선이 탄생했습니다.
이 접근법의 핵심 장점은 고정된 과거 기간 동안 가격을 단순 평균하는 대신, "추세"와 "주기 잡음"을 수학적으로 정확하게 분리한다는 점입니다.
작동 원리
이 지표는 알파(Alpha) 매개변수를 기반으로 한 재귀 공식을 사용하여 부드러운 추세선을 계산합니다. 공식에는 다음이 포함됩니다:
- 현재 및 최근 가격 데이터(HL/2 중간값)
- 이전 추세선 값
- 알파 평활 계수(기본값 0.07)
또한 이 지표는 2봉 이동된 즉시 추세선인 트리거 라인을 생성합니다. 이 트리거 라인은 교차 논리를 통해 거래 신호를 생성하는 데 사용됩니다.
해석
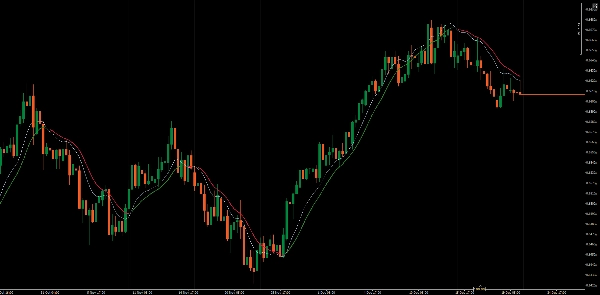
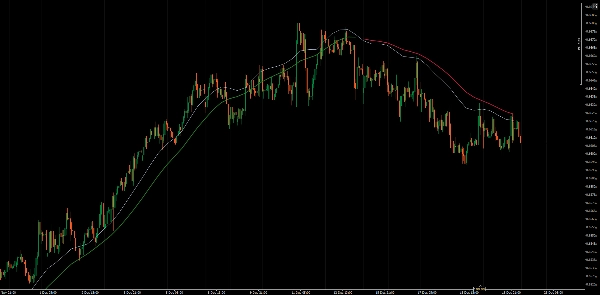
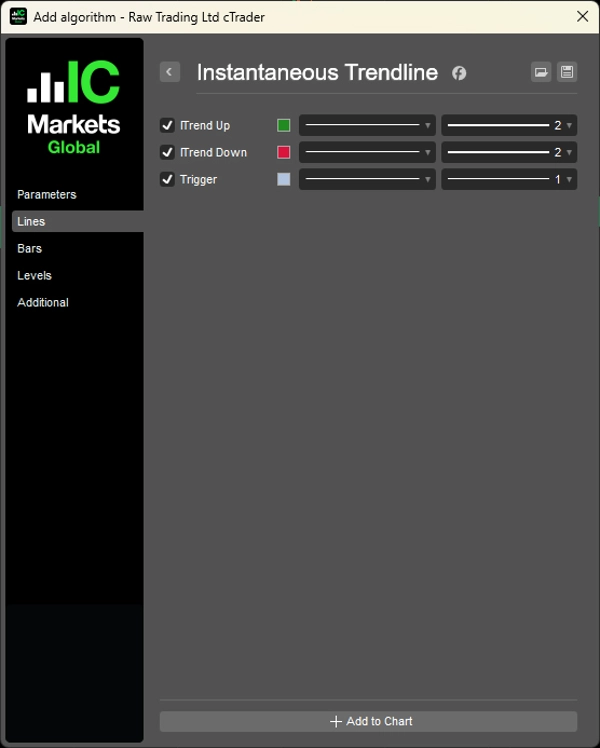
이 지표는 세 개의 선을 표시합니다:
- ITrend 상승: 트리거 > ITrend일 때 표시되며, 강세 조건을 나타냅니다
- ITrend 하락: 트리거 < ITrend일 때 표시되며, 약세 조건을 나타냅니다
- 트리거: 2봉 지연된 추세선 버전
신호 생성:
- 강세 신호: 트리거 라인이 즉시 추세선을 상향 돌파할 때
- 약세 신호: 트리거 라인이 즉시 추세선을 하향 돌파할 때
색상으로 구분된 표시 덕분에 현재 추세 방향을 한눈에 쉽게 파악할 수 있습니다.
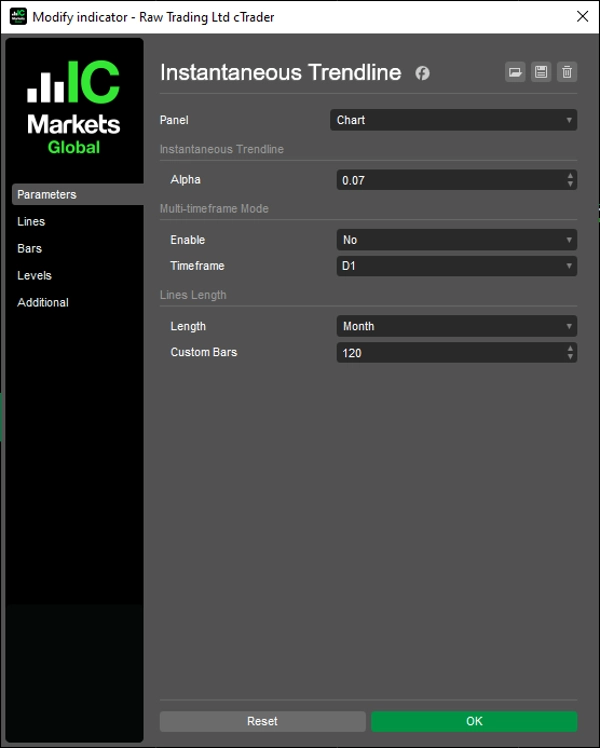
주요 매개변수
알파 (0.01 - 1.0, 기본값 0.07)
추세선의 평활화와 반응성을 제어합니다. 낮은 값은 더 부드럽고 반응이 느린 추세선을 생성하여 장기 추세에 적합합니다. 높은 값은 가격 변화에 대한 민감도를 높이지만 변동성이 큰 시장에서 더 많은 오신호를 발생시킬 수 있습니다. 기본값 0.07은 반응성과 잡음 필터링의 균형을 맞춥니다.
선 길이 (기본값 120)
차트에 표시되는 과거 추세선 데이터의 봉 수를 결정합니다. 이는 차트를 깔끔하게 유지하면서 충분한 맥락을 제공합니다.
제한 사항
- 모든 추세 추종 도구와 마찬가지로, 즉시 추세선은 횡보하거나 횡적인 시장에서 휩쏘(오신호)를 발생시킬 수 있습니다
- 강한 추세 동안에는 지표가 추세에 더 오래 머무르게 할 수 있지만, 정확한 최고점이나 최저점을 놓칠 수 있습니다
- 성능은 시장 상황(추세 vs 횡보)에 따라 크게 달라집니다
- 이 지표는 예측적이지 않고 반응적입니다 - 추세가 시작된 후에 추세를 식별합니다
__________________________________________________________________________________________
더 많은 무료 지표
구조와 거래량부터 회귀, 변동성, 맞춤 시간 프레임까지 다양한 시장 분석 도구를 탐색해 보세요.
소스 코드는 GitHub 저장소에서 확인할 수 있습니다.
모두 무료로 사용할 수 있습니다. 하지만 커피 지원을 보내고 싶다면 여기로 보내실 수 있습니다.
지지/저항
거래량
이동평균
유틸리티/맞춤형
회귀 기반
변동성
오실레이터
__________________________________________________________________________________________
면책 조항
거래에는 위험이 따릅니다. 이 지표는 기술적 분석 용도로만 사용되며, 항상 적절한 위험 관리와 책임 있는 거래를 적용해야 합니다.
피드백 및 개선 사항
제안, 기능 요청 또는 개선 아이디어가 있으면 토론 탭에 댓글을 남겨 주세요. 여러분의 피드백은 모두를 위한 지표 개선에 도움이 됩니다.
요약
고객 리뷰
5 | 100 % | |
4 | 0 % | |
3 | 0 % | |
2 | 0 % | |
1 | 0 % |


