Beschreibung
ÜBERSICHT
Volume Spread Analysis (VSA) ist eine von Tom Williams, einem ehemaligen Syndikatshändler, entwickelte Methodik, die auf der Arbeit von Richard Wyckoff aus den frühen 1900er Jahren basiert. VSA interpretiert die Beziehung zwischen Volumen, Kurs-Spanne (Range) und Schlusskurslage, um Ungleichgewichte von Angebot und Nachfrage zu identifizieren.
Wichtige VSA-Konzepte:
- Volumen zeigt die Aktivitätsmenge - wer beteiligt ist
- Spanne zeigt Volatilität und Unsicherheit - wie weit sich der Preis bewegt hat
- Schlusskurslage zeigt, wer die Kerze gewonnen hat - Käufer oder Verkäufer
- Kontext zeigt, wo wir uns im Marktzyklus befinden - Stärke- oder Schwächephase
Wenn das Volumen bei weiter Spanne zunimmt, aber der Preis kaum vorankommt, deutet dies auf Absorption hin (eine Seite nimmt den Druck der anderen auf). Wenn das Volumen bei enger Spanne in einem Trend abnimmt, deutet dies auf mangelnde Teilnahme hin (potenzielle Schwäche).
Diese Implementierung:
Dieser Indikator quantifiziert VSA-Konzepte mit statistischen Methoden. Er unterscheidet sich in mehreren Punkten vom traditionellen VSA:
- Verwendet
(close - open) / rangeals Effizienzmaß (nicht im ursprünglichen VSA) - Absorptionsmuster identifizieren "eine Seite gewinnt" statt traditioneller "Druckabsorption"
- ENR (Effort No Result) wird mit Effizienzschwelle quantifiziert; ursprüngliches VSA ist interpretativer
- Verwendet getrimmten Mittelwert für Volumendurchschnitt (ausreißerresistent) und Perzentilrang für Spanne
- Beinhaltet nicht: Stoppvolumen, Upthrust, Test-, Shakeout-Muster
Dies ist ein quantifizierter, algorithmischer Ansatz zu VSA-Konzepten. Traditionelles VSA ist interpretativer und kontextabhängiger. Verwenden Sie diesen Indikator als ein Analysewerkzeug unter vielen, nicht als alleinige Signale.
WAS DIESER INDIKATOR TUT
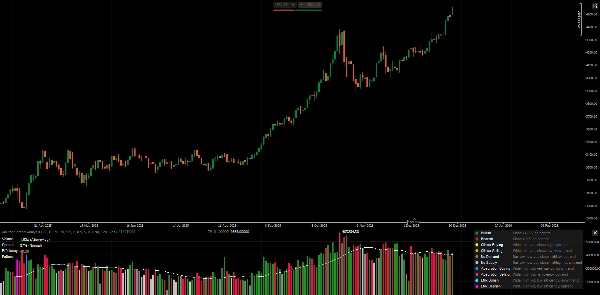
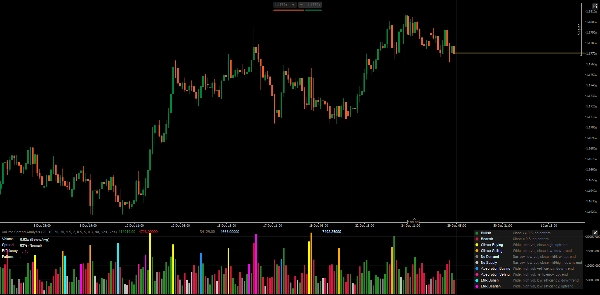
Analysiert das Volumen, die Spanne und die Schlusskurslage jeder Kerze, um potenzielle Ungleichgewichte von Angebot und Nachfrage zu erkennen. Zeigt Volumenhistogramm, farblich nach Mustertyp, mit Echtzeit-Metrik-Panel.
MUSTERDEFINITIONEN
1. Standardkerzen (Kein Muster)
- Bullisch: Schlusskurs ≥ 0,5 in der Spanne, kein spezielles Muster erkannt
- Bärisch: Schlusskurs < 0,5 in der Spanne, kein spezielles Muster erkannt
2. Climax-Muster (Potenzielle Erschöpfung)
- Climax-Kauf: Weite Spanne + ultra-hohes Volumen + hoher Schlusskurs + im Aufwärtstrend
-
- Interpretation: Mögliche Kauferschöpfung, auf Umkehr achten
- Climax-Verkauf: Weite Spanne + ultra-hohes Volumen + niedriger Schlusskurs + im Abwärtstrend
-
- Interpretation: Mögliche Verkaufsermüdung, auf Umkehr achten
3. Schwache Muster (Mangel an Überzeugung)
- Keine Nachfrage: Enge Spanne + niedriges Volumen + Schlusskurs Mitte/niedrig + im Aufwärtstrend
-
- Interpretation: Käufer unterstützen die Rally nicht, potenzielle Schwäche
- Kein Angebot: Enge Spanne + niedriges Volumen + Schlusskurs Mitte/hoch + im Abwärtstrend
-
- Interpretation: Verkäufer drücken nicht weiter nach unten, potenzielle Stärke
4. Absorptionsmuster (Eine Seite gewinnt)
- Absorptionskauf: Weite Spanne + hohes Volumen + positive Effizienz + im Abwärtstrend
-
- Interpretation: Käufer absorbieren Verkaufsdruck, potenzielle Umkehr nach oben
- Absorptionsverkauf: Weite Spanne + hohes Volumen + negative Effizienz + im Aufwärtstrend
-
- Interpretation: Verkäufer absorbieren Kaufdruck, potenzielle Umkehr nach unten
5. ENR-Muster (Aufwand ohne klares Ergebnis)
- ENR Bullisch: Weite Spanne + hohes Volumen + geringe Effizienz + im Abwärtstrend
-
- Interpretation: Hoher Aufwand, aber kein klarer Gewinner, potenzielle Unterstützung/Unentschlossenheit
- ENR Bärisch: Weite Spanne + hohes Volumen + geringe Effizienz + im Aufwärtstrend
-
- Interpretation: Hoher Aufwand, aber kein klarer Gewinner, potenzieller Widerstand/Unentschlossenheit
ERKLÄRUNG DES METRIK-PANELS
Volumen
- Zeigt das Volumen der aktuellen Kerze als Verhältnis zum getrimmten Mittelwert (z.B. "1,85x")
- Klassifikation: Niedrig / Unterdurchschnittlich / Überdurchschnittlich / Hoch / Ultrahoch
- Hohes Volumen = Marktteilnahme, aber Kontext ist wichtig
Spanne
- Zeigt Perzentilrang (0-100%) relativ zu den letzten Kerzen
- Klassifikation: Eng / Normal / Weit
- Weite Spanne = Volatilität/Unsicherheit, nicht unbedingt Richtung
Effizienz
- Formel:
(close - open) / (high - low) - Bereich: -1,0 bis +1,0
- Positiv = bullischer Körper dominiert die Spanne
- Negativ = bärischer Körper dominiert die Spanne
- Nahe Null = kleiner Körper, hoher Docht, Unentschlossenheit
Muster
- Aktuell erkanntes Muster (oder "-" wenn keines)
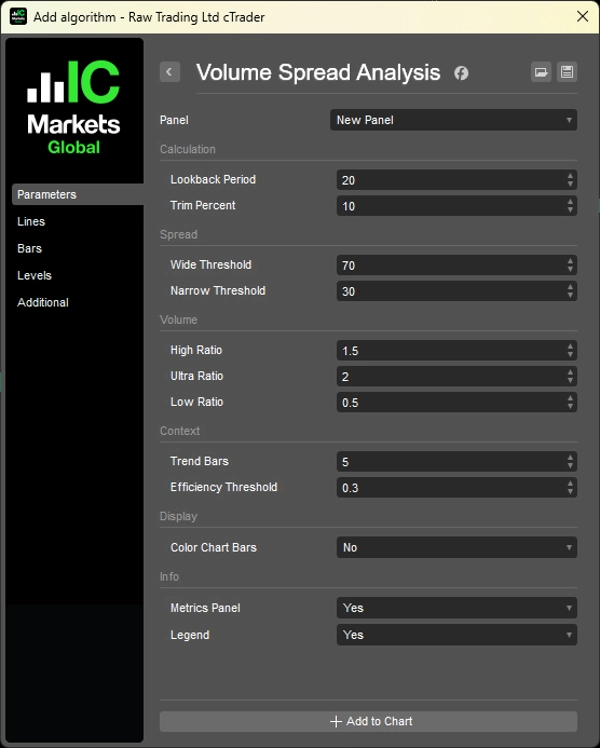
PARAMETER
1. Berechnung
- Lookback-Periode (20): Kerzen für Volumen-/Spannenstatistiken
- Trim-Prozent (10%): Entfernt Ausreißer aus der Volumenberechnung
2. Spannenklassifikation
- Weite Schwelle (70%): Perzentil zur Klassifizierung als "weit"
- Enge Schwelle (30%): Perzentil zur Klassifizierung als "eng"
3. Volumenklassifikation
- Hoher Quotient (1,5x): Schwelle über dem Durchschnitt
- Ultra-Quotient (2,0x): Ultra-hohe Schwelle
- Niedriger Quotient (0,5x): Schwelle unter dem Durchschnitt
4. Kontext
- Trendkerzen (5): Kerzen zurück zum Vergleich der Trendrichtung
- Effizienzschwelle (0,3): Minimum für "starke" Effizienz
5. Anzeige
- Farbige Chartkerzen: Musterfarben auf Preischart anwenden
- Metrik-Panel: Echtzeitmetriken anzeigen
- Legende: Musterguide anzeigen
ANWENDUNG
1. Verwenden Sie Muster nicht als direkte Handelssignale - sie zeigen potenziellen Kontext, keine Einstiege.
2. Kombinieren Sie mit der Preisstruktur - VSA funktioniert am besten zur Bestätigung dessen, was die Preisstruktur zeigt.
3. Achten Sie auf den Kontext - dasselbe Muster kann an Unterstützung und Widerstand unterschiedliche Bedeutungen haben.
4. Die Volumenperspektive ist wichtig - hohe Volumenabsorption auf Schlüsselniveau > zufällige Kerzenabsorption.
Forex-Volumenbeschränkung
Der Forex-Spotmarkt zeigt Tick-Volumen (Anzahl der Kursänderungen), nicht die tatsächlich gehandelten Kontrakte. Muster können weniger zuverlässig sein als bei Futures/Aktien mit echtem Volumen.
LEGENDE (Eingebautes Nachschlagewerk)
Aktivieren Sie den Parameter "Legende", um Musterbeschreibungen direkt im Chart anzuzeigen.
__________________________________________________________________________________________
WEITERE KOSTENLOSE INDIKATOREN
Entdecken Sie eine breite Palette von Marktanalysetools – von Struktur und Volumen bis hin zu Regression, Volatilität und benutzerdefinierten Zeitrahmen.
Der Quellcode ist auf GitHub Repository verfügbar.
Alle kostenlos nutzbar. Wenn Sie jedoch Kaffee-Unterstützung senden möchten, können Sie dies hier tun.
Unterstützung/Widerstand
Volumen
- Volumen-Aktivitätsprofiler
- Volumen-Effizienz-Analysator
- Volumenprofil-Analytik
- Volumenprofil - Aktualisiert
- Volume Spread Analysis
- VWAP (Volumen-gewichteter Durchschnittspreis)
Gleitende Durchschnitte
- SSL-Kanal
- Verankerter gleitender Durchschnitt
- Abweichungsskaliertes gleitendes Mittel
- Gann High Low Aktivator
- Instantane Trendlinie
- Kaufman Adaptive MA mit Trend Vision
- Gleitender Durchschnittskanal
- Gleitende Durchschnitte Suite
- Trendkanal gleitender Durchschnitt
Dienstprogramme/Benutzerdefiniert
Regressionsbasiert
Volatilität
Oszillatoren
__________________________________________________________________________________________
HAFTUNGSAUSSCHLUSS
Trading beinhaltet Risiken. Dieser Indikator ist nur für die technische Analyse gedacht – wenden Sie stets ein angemessenes Risikomanagement an und handeln Sie verantwortungsbewusst.
FEEDBACK & VERBESSERUNGEN
Wenn Sie Vorschläge, Funktionswünsche oder Ideen zur Verbesserung haben, hinterlassen Sie bitte einen Kommentar im Diskussions-Tab. Ihr Feedback hilft, den Indikator für alle zu verbessern.
Zusammenfassung
This implementation quantifies VSA concepts using statistical methods, including an efficiency metric defined as (close - open) / range, trimmed mean volume averaging, and percentile ranking for spread. It identifies several bar patterns: Standard (bullish/bearish), Climax (buying/selling exhaustion), Weak (No Demand/No Supply), Absorption (one side winning), and ENR (Effort No Result), each indicating different market conditions.
The indicator displays a volume histogram colored by detected pattern type and provides a real-time metrics panel showing volume ratio, spread percentile, efficiency, and current pattern. Parameters allow customization of lookback periods, volume/spread thresholds, and display options such as coloring chart bars and showing a pattern legend.
VSA is applicable across markets including Forex, stocks, indices, commodities, and crypto. Note that Forex volume reflects tick volume, which may affect pattern reliability. The indicator is designed as an analytical tool to complement price structure analysis rather than as standalone trade signals.
Kundenbewertungen
5 | 100 % | |
4 | 0 % | |
3 | 0 % | |
2 | 0 % | |
1 | 0 % |