
Beschreibung
Einer der größten Fehler, die neue Trader machen, ist, dass sie versuchen, so viele Informationen wie möglich in ein Chart zu bringen, indem sie zu viele Indikatoren hinzufügen, und das Ergebnis ist ein Chart voller Rauschen mit Linien und Daten, die alle möglichen Unsinnigkeiten liefern, die dem Trader eine widersprüchliche Geschichte erzählen.
Vorteile:
- Unheimliche Genauigkeit bei der Erkennung von Umkehrungen.
- Optisch ansprechend und leicht zu erkennen Marktbedingungen.
- Kann als Trendhandelsindikator oder als Gegen-Trend-Handelsindikator verwendet werden.
- Starke Backtesting-Ergebnisse (~95 % Genauigkeit bei Extremsignalen).
Nachteile:
- Selbst bei überkauften "Extrem"- und überverkauften "Extrem"-Bedingungen kann der Indikator manchmal dazu führen, dass Sie gegen die Richtung eines sehr starken Trends handeln, was zu großen Drawdowns führt, bevor sich der Preis schließlich umkehrt.
- Überkaufte "Extrem"- und überverkaufte "Extrem"-Signale können beim Handel auf dem 15-Minuten-Zeitrahmen und höher selten sein. Um dem entgegenzuwirken, wird empfohlen, mindestens 8 Hauptwährungspaare zu handeln, um häufig Extrem-Signale zu erhalten.
Wie man Chaos Reversals verwendet
Ein einfaches und erfolgreiches System mit Chaos kann erstellt werden, indem wöchentliche und tägliche Unterstützungs- und Widerstandslinien markiert werden und gegen den Trend gehandelt wird, indem die ankommenden Abpraller von diesen Unterstützungs- und Widerstandslinien mit den überkauften Extrem- und überverkauften Extremsignalen des 15-Minuten-Chaos gehandelt werden.
Signale werden wie folgt generiert:
- Schneller W%R bewegt sich zuerst, gefolgt vom langsamen W%R.
- Wenn der einzelne, schnelle W%R überverkauft oder überkauft ist, können Sie diese Umkehrungen scalpieren.
- Wenn sowohl schneller als auch langsamer W%R überverkauft oder überkauft sind, zeigen diese an, dass der Markt sich um einen signifikanten Betrag umkehren wird.
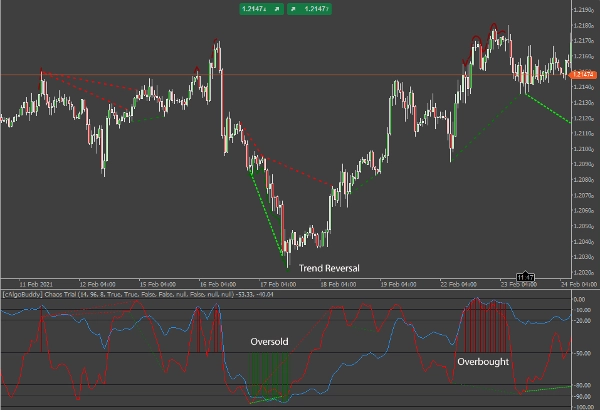
Der Indikator zeichnet eine rote oder grüne Linie über die Tiefs oder Hochs im Preisdiagramm sowie rote oder grüne Linien im Indikatorbereich, um die extrem überverkauften oder überkauften Bedingungen zu markieren. Sie können dies in den Optionen des Indikators deaktivieren.
Divergenzen erkennen
Da W%R ein Oszillator ist, bietet er uns die Möglichkeit, Divergenzen zu erkennen und zu handeln. Es gibt zwei Haupttypen von Divergenz: Regulär und Versteckt.
- Reguläre Divergenz ist ein Hinweis auf eine Umkehr der Preisrichtung.
- Versteckte Divergenz ist ein Hinweis auf eine Fortsetzung der Preisrichtung.
Innerhalb jedes Haupttyps gibt es eine sekundäre Klassifikation: Bärisch (Negativ) und Bullisch (Positiv).
- Eine bärische Divergenz tritt auf, wenn der Indikator fällt, während der Preis entweder steigt oder sich seitwärts bewegt.
- Eine bullische Divergenz tritt auf, wenn der Indikator steigt, während der Preis entweder fällt oder sich seitwärts bewegt.
Reguläre Divergenz
Reguläre Divergenz in einfachen Worten ist, wenn:
- Der Preis höhere Hochs macht, während die schnelle W%R-Linie niedrigere Hochs macht: Potenzieller Short.
- Der Preis niedrigere Tiefs macht, während die schnelle W%R-Linie höhere Tiefs macht: potenzieller Long.
In beiden Fällen sucht ein Trader nach einer potenziellen Umkehr im Preisverlauf.
Reguläre Divergenz wird am besten als Vergleich des aktuellen Swing High oder Swing Low mit dem vorherigen aktuellen Swing High oder Swing Low verwendet. Bei regulärer Divergenz schwächt sich der Trend ab und die Marktstimmung hat sich in die entgegengesetzte Richtung verschoben. Trader können sich darauf vorbereiten, eine günstige Umkehr oder Korrektur zu handeln.
In den Chaos Reversals wird reguläre Divergenz wie folgt dargestellt:
- Bullische reguläre Divergenz – hellgrüne, schmal gestrichelte Linie.
- Bärische reguläre Divergenz – rote, schmal gestrichelte Linie
HINWEIS: Divergenzlinien erscheinen beim Öffnen der Kerze nach einer bestätigten Divergenz.
Versteckte Divergenz
Versteckte Divergenz in einfachen Worten ist, wenn:
- Die schnelle W%R-Linie niedrigere Tiefs macht, während der Preis höhere Tiefs macht: ein potenzieller Long.
- Die schnelle W%R-Linie höhere Hochs macht, während der Preis niedrigere Hochs macht: ein potenzieller Short.
In beiden Fällen sucht ein Trader nach einer potenziellen Fortsetzung im Preisverlauf.
Versteckte Divergenz wird am besten verwendet, um Preise in Bezug auf den vorherrschenden Trend zu bewerten. Nach einem Rücksetzer setzt der Preis oft die Bewegung in Richtung des Trends zum Niveau des letzten Swing High oder Swing Low fort. Bei versteckter Divergenz kann sich der Trend abschwächen, ist aber noch nicht abgeschlossen. Wie unten gezeigt, zog sich der Markt wahrscheinlich aufgrund von Gewinnmitnahmen zurück und scheint den Abwärtstrend fortzusetzen.
In den Chaos Reversals wird versteckte Divergenz wie folgt dargestellt:
- Bärische versteckte Divergenz – grüne, breit gestrichelte Linie
- Bullische versteckte Divergenz – dunkelrote, breit gestrichelte Linie
Handel mit Divergenz
Dies ist eine kurze Warnung beim Handel mit Divergenz. Seien Sie sich bewusst, dass sich der Markt möglicherweise nicht in Richtung eines Divergenzsignals bewegt. Es ist wichtig zu verstehen, dass Divergenz ein Hinweis auf eine potenzielle Änderung oder Fortsetzung der Marktrichtung ist. Es ist wichtig, die Preisbewegung zu überwachen, um die Marktrichtung zu bestätigen. Beachten Sie auch die Gesamtrichtung des Chaos-Indikators, indem Sie die Indikatorlinien mit den Niveaus vergleichen (0 für extrem überkauft, -100 für extrem überverkauft)
Alarme & Benachrichtigungen
Signale, die gesendet werden, sind Beginn und Ende von extrem überkauften/überverkauften Zuständen, langsame W%R-Peaks in extremen Positionen sowie alle Divergenzen.
Telegram-Alarme
Vorausgesetzt, Sie haben einen Bot und einen Kanal in Telegram eingerichtet, sendet der Chaos Reversals Indikator Ihnen Nachrichten für bestätigte Signale zum Währungspaar.
WICHTIG:
Bitte stellen Sie sicher, dass Ihre Zeitzone korrekt auf Ihre Ortszeit eingestellt ist (unten rechts in der Anwendung).
Desktop-Alarme
Wenn Sie Ja auswählen, sendet der Chaos Reversals Indikator eine Benachrichtigung in Form eines Nachrichtenfensters bei bestätigten Signalen auf Ihrem persönlichen Desktop.
E-Mail-Alarme
Damit diese Funktionalität funktioniert, müssen Sie zuerst Ihren cTrader so konfigurieren, dass E-Mails gesendet werden können (Einstellungen-> E-Mail).
Zusammenfassung
Kundenbewertungen
5 | 100 % | |
4 | 0 % | |
3 | 0 % | |
2 | 0 % | |
1 | 0 % |


