
Beschreibung
Der Zweck dieses cTrader-Algorithmus des Boxify-Indikators besteht darin, die Kursbewegung in Zonen oder besser gesagt in Boxen zu unterteilen. Auf diese Weise kann der Trader einen Vorteil bei seinen Handelspositionen erlangen. Dies ist kein Indikator, der eigenständig funktioniert, sondern eher ein nützliches Werkzeug, das jede Handelsstrategie oder jedes Setup ergänzen kann.
Das Erkennen von Seitwärtsbewegungen kann dem Trader helfen, Gewinne zu sichern, Verluste zu begrenzen oder Limit-Orders zu seinen Gunsten zu platzieren. Dies sind einige Möglichkeiten, wie wir eine Box verwenden können:
Konsolidierungsbereiche erkennen
Für vergangene Boxen, die mehrere Bars enthalten, können wir mit Sicherheit annehmen, dass es sich um Konsolidierungsbereiche handelt und dass eine Seitwärtsbewegung vorliegt. Diese Bereiche können in Ihrer Analyse der Kursbewegung als Unterstützungs- oder Widerstandsniveaus dienen.
Platzieren Sie Ihre Trades besser
Falls Sie ein Setup für einen Trade haben und sehen, dass der Kurs sich in einer Box bewegt, können Sie die Box immer als Richtlinie für die Kursbewegung verwenden, um eine vorteilhaftere Position für Ihren Trade zu erhalten. Die aktuell entstehende Box kann verwendet werden, um Gewinne in einer Gewinnposition zu sichern, in einen Trendmarkt erneut einzusteigen oder Stop-Losses zu platzieren.
Limit-Orders platzieren
Die lange Seitwärtsbewegung führt schließlich zu Ausbrüchen. Boxify kann Ihnen helfen, Limit-Orders oberhalb oder unterhalb zu platzieren, um das Beste aus dem Beginn eines Ausbruchs herauszuholen.
Indikatoroptionen
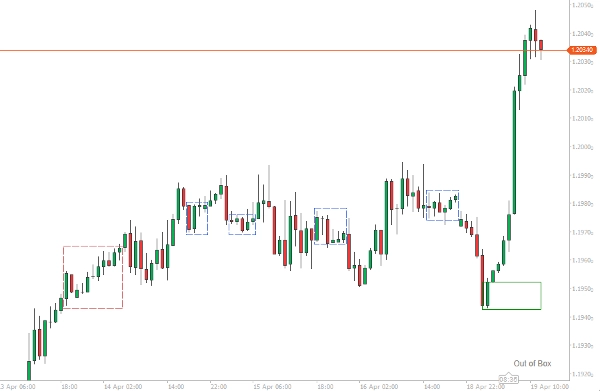
Der Indikator versucht, den Kurs von mindestens 2 Bars und mehr zu boxen. Nachrichten vom Indikator erscheinen unten rechts im Chartbereich.
- Wenn der Kurs im Trend liegt, erscheint die Nachricht „Out of Box“.
- Wenn der Kurs sich in einer Box bewegt, erscheint die Nachricht „Boxing“.
- Wenn der Kurs sich in einer Box bewegt und die obere Grenze durchbricht, erscheint „Breaking High“.
- Wenn der Kurs sich in einer Box bewegt und die untere Grenze durchbricht, erscheint „Breaking Low“.
Boxen gelten als abgeschlossen bei der Eröffnung eines neuen Bars, da der Kurs immer wieder in die Box zurückfallen kann.
Minimale Bars für Box
Diese Zahl gibt die minimale Anzahl von Bars an, die eine Box haben muss, um als abgeschlossen zu gelten. Verwenden Sie niedrigere Zahlen für Einstiegspunkte und höhere Zahlen für Konsolidierungsbereiche.
ATR-Filter
Boxify verfügt intern über einen ATR-Indikator, den Sie als Filteroption verwenden können, falls Sie die Boxbildung bei jedem Bar stoppen möchten, dessen Länge (Hoch-Tief) den ATR-Wert überschreitet. Verwenden Sie diese Option, wenn Sie Trades eingehen möchten.
Überlappungen zusammenführen
Der Beginn einer Box kann vor dem Ende der vorherigen Box liegen (besonders wenn wir eine sehr niedrige Zahl für die Boxlänge gewählt haben). Wir können diese Boxen mit dieser Option zusammenführen, sodass wir eine größere Box sehen – Diese Boxen haben eine blau gefärbte Umrandung.
Toleranz
Eine Zahl, die die Toleranz widerspiegelt, die die oberen/unteren Grenzen der Boxen haben können. Kleine Zahlen sollten verwendet werden, wenn wir Trades eingehen möchten, größere Zahlen sollten verwendet werden, wenn wir Konsolidierungsbereiche finden möchten.
Zusammenfassung
Kundenbewertungen
5 | 33 % | |
4 | 67 % | |
3 | 0 % | |
2 | 0 % | |
1 | 0 % |


