present
Registrieren Sie sich und erhalten Sie $50 Rabatt auf Ihren ersten Kauf
Trading product for Volume Profile Pro v1.0 Indikator Premium/Discount  Key Levels, image 1
Volume Profile Pro v1.0
Indikator
4 käufe
Version 1.0, Apr 2026
Windows, Mac
4.3
Bewertungen: 3
Trading product for Volume Profile Pro v1.0 Indikator Premium/Discount  Key Levels, image 2
Trading product for Volume Profile Pro v1.0 Indikator Premium/Discount  Key Levels, image 3
Trading product for Volume Profile Pro v1.0 Indikator Premium/Discount  Key Levels, image 4
Trading product for Volume Profile Pro v1.0 Indikator Premium/Discount  Key Levels, image 5
Trading product for Volume Profile Pro v1.0 Indikator Premium/Discount  Key Levels, image 6
Seit 18/01/2026
12
Verkäufe

Beschreibung

Der Volume Profile Pro ist ein hochgradig anpassbarer und leichter Volume Profile Indikator für cTrader, bei dem Sie viele Einstellungen nach Ihren Vorlieben anpassen können, einschließlich des Point Of Control (POC), Value Area High (VAH) und Value Area Low (VAL)


Was er tut

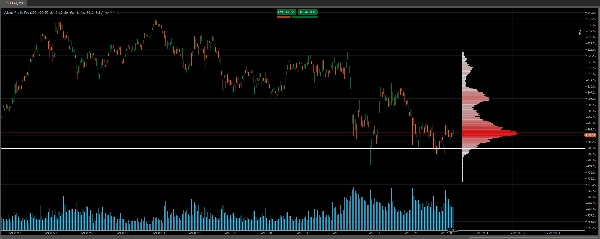
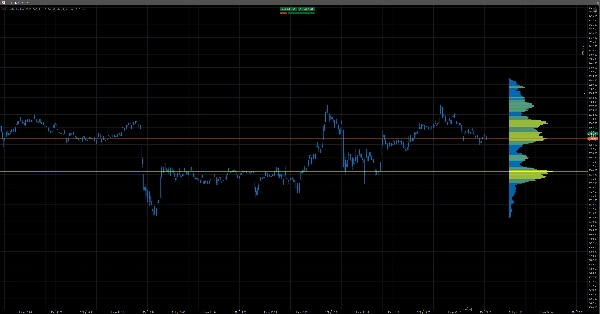
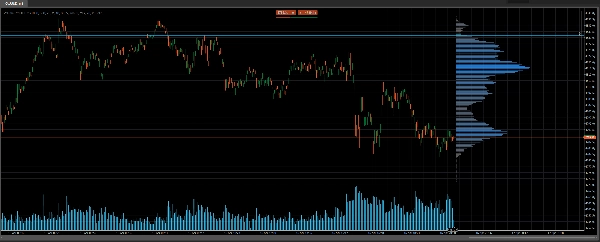
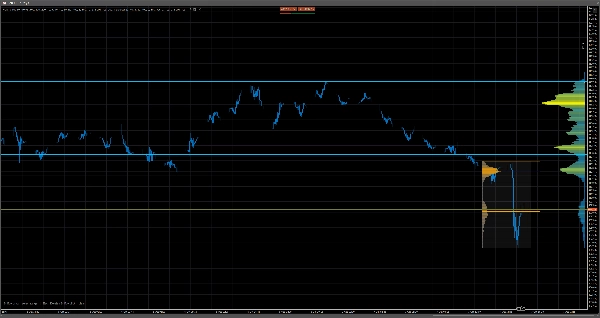
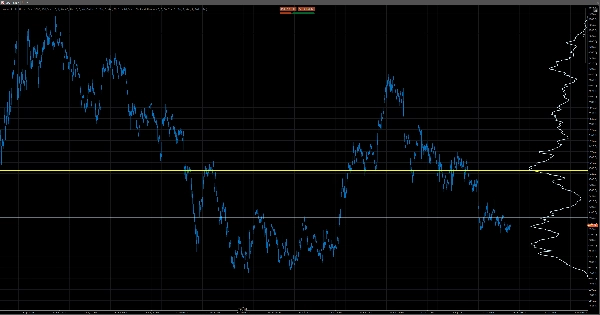
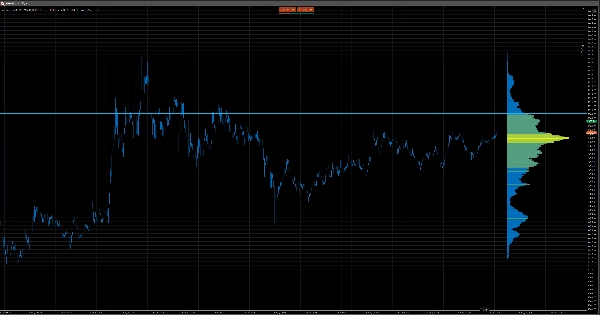
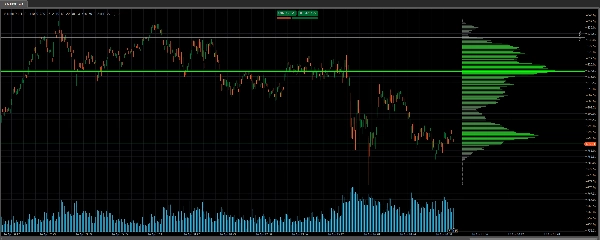
Volume Profile Pro zeichnet ein horizontales Histogramm direkt in Ihr cTrader-Chart, das zeigt, wie viel Volumen auf jedem Preisniveau über ein konfigurierbares Rückblickfenster gehandelt wurde. Anstatt das Volumen über die Zeit zu messen, misst es das Volumen nach Preis — und zeigt sofort, wo der Markt das meiste Geschäft abgewickelt hat. Daraus berechnet und zeichnet es automatisch drei Schlüsselniveaus: den Point of Control (POC), den Preis mit dem höchsten gehandelten Volumen; sowie das Value Area High (VAH) und Value Area Low (VAL), die Grenzen des Preisbereichs, der 70 % des gesamten gehandelten Volumens enthält (konfigurierbar).


Wie es funktioniert

Der Indikator scannt eine vom Benutzer definierte Anzahl historischer Bars, findet den Hoch-Tief-Preisbereich und teilt ihn in gleichmäßig verteilte Preisreihen auf. Das Tick-Volumen jeder Bar wird dann auf jede Preisreihe verteilt, die sie überspannt. Das Ergebnis ist ein Volumen-nach-Preis-Histogramm mit anpassbaren Balkenbreiten proportional zum Volumen und einem Farbverlauf, der von Reihen mit niedrigem zu hohem Volumen wechselt. Es läuft vollständig auf Standard-Bar-Level-OHLCV-Daten — kein Tick-Feed, kein DOM, keine externe Datenquelle erforderlich — und berechnet nur beim letzten Balken neu, wodurch es schnell, leicht und nicht störend bleibt.


Hochgradig anpassbar

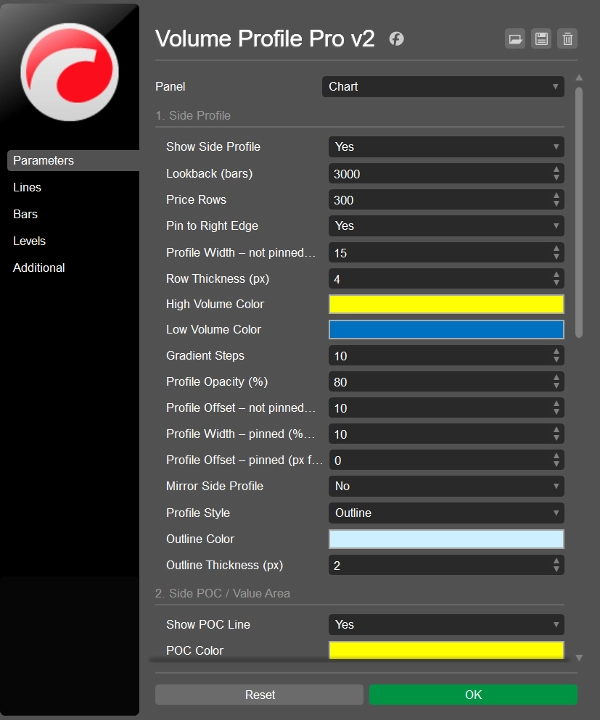
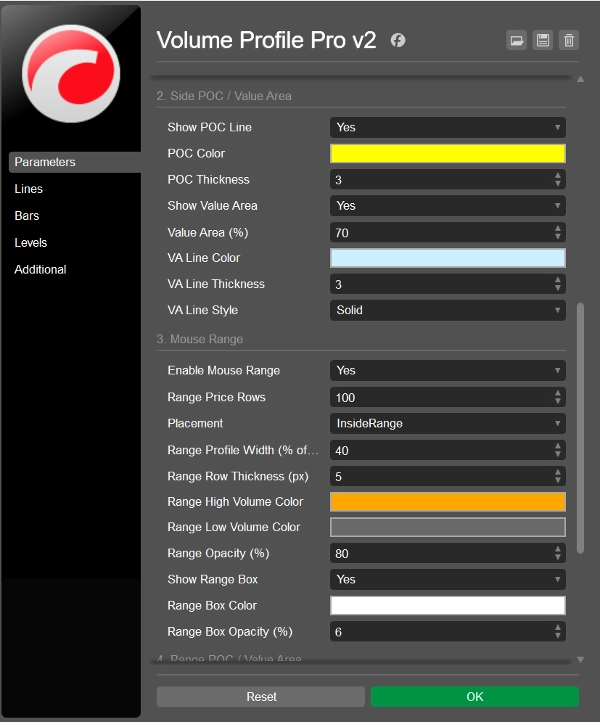
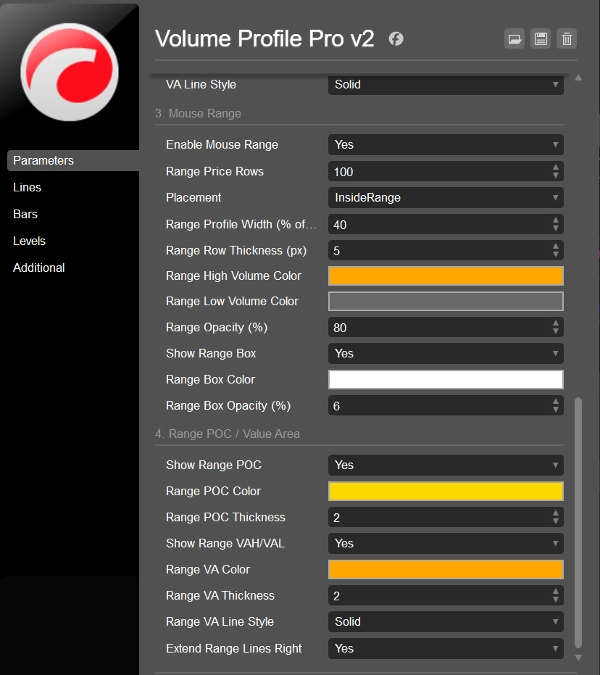
Fast jedes visuelle und analytische Element ist anpassbar: Rückblickzeitraum, Anzahl der Preisreihen, Profilbreite, Reihenstärke, Deckkraft, Farbverlaufschema, POC-Farbe und -Stärke, Schwellenwert für den Value Area Prozentsatz und VA-Linienstil. Dadurch ist es gleichermaßen als dezente Hintergrundreferenzschicht oder als mutiges eigenständiges Analysetool verwendbar.


Für wen das ist

  • Trader, die einen leichten Volume Profile Indikator wollen
  • Trader, die ein sauberes aussehendes Volume Profile wünschen
  • Trader, die den Rückblickzeitraum im Chart selbst einstellen möchten
  • Trader, die die Möglichkeit haben möchten, viele Farben und Deckkraft einzustellen
  • Trader, die Breite und Platzierung im Chart anpassen wollen
  • Trader, die die Anzahl der Preisreihen einstellen möchten (empfohlen, dies unter 400 zu halten)
  • Trader, die die Point Of Control (POC), Value Area High (VAH) und Value Area Low (VAL) Linien ein- oder ausschalten und das Erscheinungsbild anpassen möchten


Kombinieren Sie dies mit unserem Level 2 DOM Volume Delta Pro Indikator für noch besser informierte Entscheidungen an Schlüsselniveaus: https://ctrader.com/products/4138


Sehen Sie hier unseren erstaunlichen Black Box Bot: https://ctrader.com/products/3241


Zusammenfassung

KI-Zusammenfassung
Volume Profile Pro is a customizable volume profile indicator designed for cTrader. It displays a horizontal histogram on the chart representing traded volume by price level over a user-defined lookback period. The indicator identifies and plots three key levels: Point of Control (POC)—the price with the highest traded volume, Value Area High (VAH), and Value Area Low (VAL), which define the price range containing a configurable percentage (default 70%) of total volume.

The tool analyzes historical bar data by dividing the high-to-low price range into evenly spaced rows and distributing each bar’s tick volume across these rows. This creates a volume-at-price histogram with adjustable bar widths proportional to volume and a gradient color scheme indicating volume intensity. It operates solely on standard OHLCV bar data without requiring tick feeds or external sources, recalculating only on the latest bar to maintain performance.

Users can extensively customize visual and analytical settings, including lookback period, number of price rows, profile width, opacity, colors, and the appearance and visibility of POC, VAH, and VAL lines. This flexibility allows the indicator to serve as either a subtle background reference or a prominent analytical tool. It supports analysis of key market structure concepts such as supply and demand, support and resistance, and liquidity zones.
Indikatorprofil
Indikatorkategorie
Volumen
Ausgabetyp
Visualisierung
Datenanforderungen
Volumen
Tick-Daten
DoM
Unterstützte Signale
Ausbruch
Wendepunkt
Level – Durchbrechen
Level – Berührung
Volatilität

Kundenbewertungen

4.3
Bewertungen: 3
5
33 %
4
67 %
3
0 %
2
0 %
1
0 %
Kundenbewertungen
May 1, 2026
Fine for a side read, especially when the chart is not clean.
April 27, 2026
it works as a side layer because it supports the plan without acting like the plan, and 2 sessions is the line to watch.
April 22, 2026
not bad if the rules are already clear. 30 days gives the idea room.

Diskussion

Häufig gestellte Fragen (FAQ)

Premium/Discount
Key Levels
Volume
Market Structure
Supply & Demand
Liquidity Grab
Support & Resistance
Über den cTrader Store verfügbare Produkte, einschließlich Handelsbots, Indikatoren und Plugins, werden von externen Entwicklern bereitgestellt und nur zu Informations- und technischen Zugriffszwecken verfügbar gemacht. cTrader Store ist kein Broker und erbringt keine Anlageberatung, persönlichen Empfehlungen oder eine Garantie für zukünftige Performance.

Mehr von diesem Autor

cBot
Volume
XAUUSD
+5
The Black Box Bot, A New Revolution. Make up to almost 700% per year on Gold m5.
Indikator
BOS
Volume
+5
The Volume Delta Indicator using Institutional Level 2 DOM Data, The Edge Institutions Pay Millions For, now on cTrader

Das könnte Sie auch noch interessieren

Indikator
Auto Fibonacci Retracement Indicator for cTrader
„Vwap Bands“-Logo
Beste Ratings
4.5
(4)
$19
/
$29
Indikator
VWAP
Moving Average
Vwap Bands it is highly sought after by professional traders because it includes Standard Deviation Bands
Indikator
EMA
A visual signal backtester that simulates trades directly on your chart and scores strategy performance.
Indikator
BOS
CHOCH
+5
MyZTrade High TF candle is a multi-timeframe visualisation tool that overlays completed higher-timeframe candles.
Indikator
Pin Bar
Inducement
+5
Institutional Nasdaq Session Liquidity Map with Live Point HUD, Sweep Alerts & Interactive Playbook.
Indikator
BOS
EMA
+5
Directional volume heatmap: see if a price zone was built on buying or selling, not just how much.
Indikator
Prop
Forex
+10
Heatmap Pro analiza la volatilidad, el volumen y la acción del precio para "pintar" tu gráfico con zonas de color.
Indikator
The long awaited new and improved Supply Demand Premium V2 indicator. Unlock greater trading opportunities now!
Indikator
SMC
Prop
+17
Unlock the true intent of market participants with the Classic Proportional Cumulative Volume Delta CVD!
Indikator
Forex
BTCUSD
+13
Sniper Zone Pro: High-precision institutional zones and candle strength for identifying key market tests.
Indikator
Triangle
Double Top
+5
Know which liquidity sweeps are real. Auto-tracks EQH/EQL and confirms genuine reversals, not just broken levels.
Indikator
Plot higher-timeframe Bollinger Bands for clearer structure, pullback zones, and breakout signals—without switching char
Indikator
AI
ATR
+27
Deep Mood Distribution (DMD) is a segmented volume-profile and sentiment tool that analyzes price action in fixed bar bl
Indikator
RSI
Signal
+2
Dynamic circles visualize price's volatility position. Like RSI for market overextension & stretch. Quantify context.
Indikator
Forex
Crypto
+3
Day of Week Indicator for cTrader
Indikator
Prop
Forex
+5
Tracks NY, London, Tokyo, Sydney sessions with custom visuals, and a real-time expanding range box and breakout High/Low
Indikator
ATR
Channel
+1
Bollinger Bands Advanced Squeeze & Breakout System, Real-Time On-Chart Dashboard, Auto-Squeeze Detector, Dual-Band Cloud
Indikator
Prop
Forex
+13
Identifies market compression zones and explosive Breakout moments using mathematical modeling.

Preis

Seit 18/01/2026
12
Verkäufe