present
Registrieren Sie sich und erhalten Sie $50 Rabatt auf Ihren ersten Kauf
Trading product for Tradingfcs_vwap Indikator VWAP Support & Resistance, image 2
Trading product for Tradingfcs_vwap Indikator VWAP Support & Resistance, image 3
Trading product for Tradingfcs_vwap Indikator VWAP Support & Resistance, image 4
Trading product for Tradingfcs_vwap Indikator VWAP Support & Resistance, image 5
Trading product for Tradingfcs_vwap Indikator VWAP Support & Resistance, image 6
Seit 05/07/2026
38.9M
Gehandeltes Volumen
327.09K
Pip-Gewinn

Beschreibung

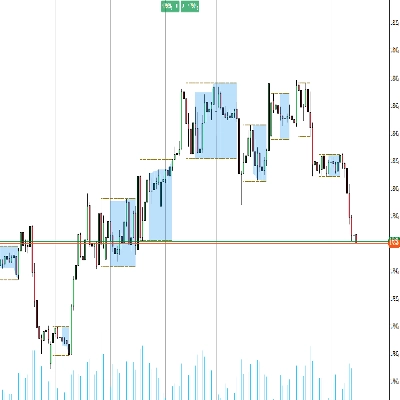
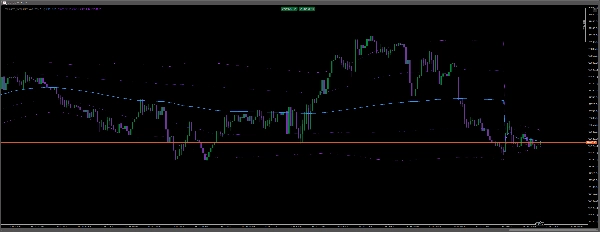
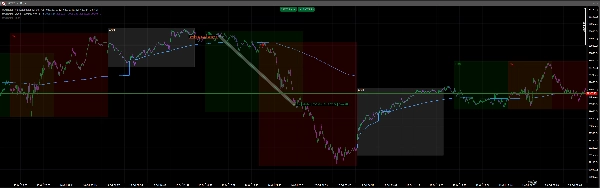
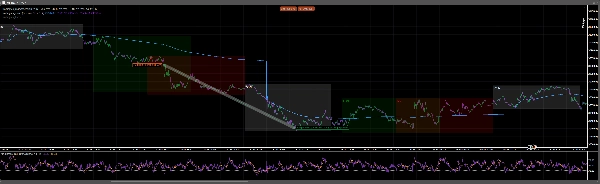
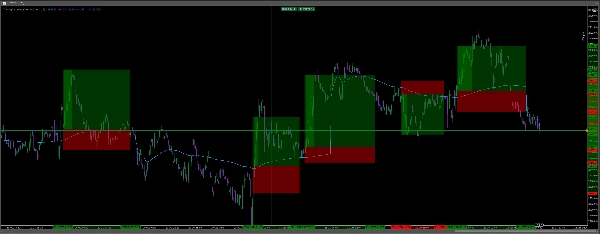
  • 🔵 Blaue VWAP-Linie: Stellt den volumengewichteten durchschnittlichen Handelspreis dar und hilft dabei, die Intraday-Marktrichtung sowie dynamische Unterstützung oder Widerstand zu erkennen.


  • 🟣 Lila Abweichungsbänder: Hervorhebung von Bereichen, in denen der Preis sich von seinem Durchschnitt entfernt hat, um Händlern zu helfen, potenzielle Überdehnungen und Umkehrmöglichkeiten zu erkennen.


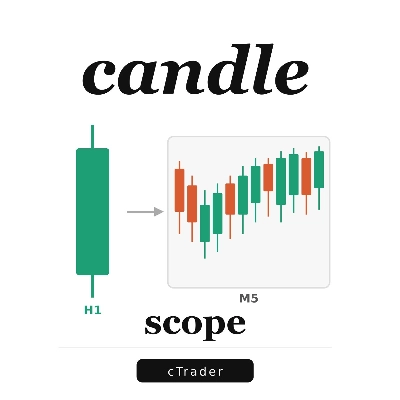
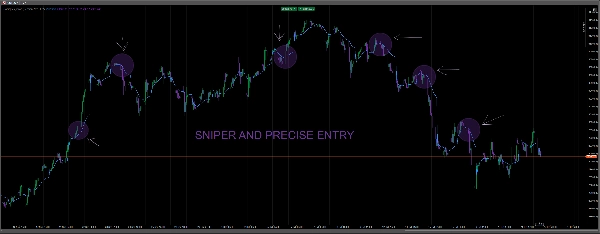
  • 📈 Preisabweisungen: Das hervorgehobene H1-Diagramm zeigt, wie Preisreaktionen rund um den VWAP bullische oder bärische Bewegungen ankündigen können.


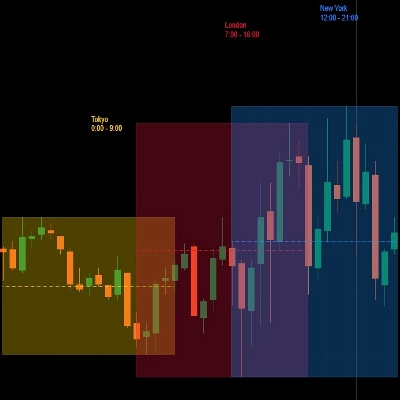
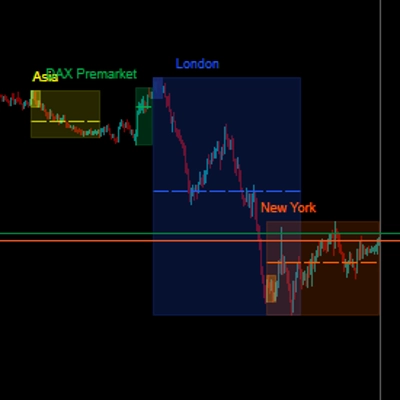
⏰ Handelssitzungen: Ihre separaten Sitzungsüberlagerungen identifizieren asiatische, Londoner und New Yorker Handelsperioden und helfen Ihnen, Chancen unter verschiedenen Marktbedingungen zu bewerten.

----------------------------------


Wie es Händlern hilft, Chancen zu erkennen

🟢 KAUF-Chancen: Wenn der Preis über dem VWAP bleibt und diesen erfolgreich als Unterstützung testet, können Händler auf eine bullische Fortsetzung setzen.

🔴 VERKAUF-Chancen: Wenn der Preis unter dem VWAP handelt und diesen als Widerstand abweist, können Händler eine potenzielle bärische Fortsetzung erkennen.

⚡ Präzisions-Scalping: Auf den Zeitrahmen M1 und M5 hilft der VWAP Händlern, potenzielle Einstiege, Rücksetzer und Ausstiege mithilfe von Preisaktion und Momentum-Bestätigung zu identifizieren

Zusammenfassung

KI-Zusammenfassung
Tradingfcs_vwap is a technical indicator designed to assist traders in identifying intraday market trends and potential trade entries using the Volume Weighted Average Price (VWAP). It features a blue VWAP line that reflects the average trading price weighted by volume, serving as a dynamic support or resistance level. Purple deviation bands highlight price movements away from the VWAP, indicating possible overextensions and reversal points.

The indicator also visualizes price rejections on the hourly chart, showing how price interactions with the VWAP can signal bullish or bearish moves. Separate overlays mark the Asian, London, and New York trading sessions, enabling traders to assess market behavior across different periods.

Key trading signals include:
- Buy opportunities when price holds above VWAP and retests it as support.
- Sell opportunities when price trades below VWAP and rejects it as resistance.
- Precision scalping on 1- and 5-minute timeframes by identifying entries, pullbacks, and exits through price action and momentum confirmation.

This tool supports analysis based on volume, support and resistance, and trend strength, using bar data inputs and providing signal outputs for enhanced decision-making in various trading styles.
Indikatorprofil
Indikatorkategorie
Unterstützung und Widerstand
Ausgabetyp
Signale
Datenanforderungen
Nur Balken
Unterstützte Signale
Trendstärke

Diskussion

Kundenbewertungen

4.0
Bewertungen: 1
5
0 %
4
100 %
3
0 %
2
0 %
1
0 %
Kundenbewertungen
October 22, 2026
VWAP and deviation bands give the H1 rejection examples a clear reference. Session overlays add timing, and the description distinguishes holding above the average from rejecting below it. A useful context view rather than one mechanical rule for every band touch.

Häufig gestellte Fragen (FAQ)
VWAP
Support & Resistance
Über den cTrader Store verfügbare Produkte, einschließlich Handelsbots, Indikatoren und Plugins, werden von externen Entwicklern bereitgestellt und nur zu Informations- und technischen Zugriffszwecken verfügbar gemacht. cTrader Store ist kein Broker und erbringt keine Anlageberatung, persönlichen Empfehlungen oder eine Garantie für zukünftige Performance.

Das könnte Sie auch noch interessieren

Indikator
BOS
CHOCH
+2
The full SMC suite: BOS / CHoCH / MSS, FVG, liquidity, order blocks and a 0-100 confluence score. No repaint.
Indikator
cTreder Smart SMA
„PivotLevels“-Logo
Beste Ratings
4.7
(4)
$25
Indikator
Prop
Forex
+4
It draws Pivot Levels on the chart.
Indikator
ATR
Volume
+2
Nine timeframe cards, vivid candles, native BUY/SELL arrows and adjustable ATR-buffer stop-loss reference lines.
Indikator
Inside Bar
Save time by lighting a candle to look within yourself in another temporality
Indikator
Prop
Forex
+12
Identify and trade breakouts with Consolidation Zones! Visualize price consolidation areas for trading opportunities.
Indikator
Prop
Forex
+5
Pivot Point with base zone daily Asia-London-New york Session.
Indikator
Market Sessions
Indikator
RSI
Prop
+14
Unlock Stochastic RSI PRO in cTrader! Overlay RSI, highlight zones, and identify divergences with customizable settings.
Indikator
SMC
Prop
+11
Sessions PRO is a professional session visualization indicator - 4 Fully Customizable Sessions
Indikator
BOS
EMA
+5
Market structure signals graded A to C, each with a drawn trade plan, plus an adaptive trend ribbon and a trend matrix
Indikator
AI
ATR
+25
On-chart draggable panel to show/hide Positions & Pending Orders with fixed warning banner and inline alerts per symbol.
Indikator
AI-assisted
Order Block
+5
The daily bias estimator indicator uses ICT concepts to show whether the chart is bullish or bearish on multi-time frame
Indikator
AI
ATR
+26
Session Volume Profile + Composite. POC/VAH/VAL, Focus/Solo. Fast, clean, no ghosts, live-ready.
Indikator
ATR
RSI
+6
💹 Define a price channel 📈 and determine trend direction (bullish 🟢 or bearish 🔴).
Indikator
SMC
Prop
+12
Multi-TF FVG + Smart Fibonacci
Indikator
AI
ATR
+10
FX Sniper: Multi-pair Forex analysis tool. Features trend logic, adaptive pivots, and momentum filtering for major pairs
Indikator
Volume
Order Block
+3
Map market structure, order blocks, liquidity and key zones with an interactive cTrader dashboard.

Preis

Seit 05/07/2026
38.9M
Gehandeltes Volumen
327.09K
Pip-Gewinn