present
Sign up and get $50 off your first purchase
Trading product for Multi VWAP Indicator Premium/Discount  Key Levels, image 1
Multi VWAP
Indicator
Version 1.0, Oct 2026
Windows, Mac
Trading product for Multi VWAP Indicator Premium/Discount  Key Levels, image 2
Trading product for Multi VWAP Indicator Premium/Discount  Key Levels, image 3
Trading product for Multi VWAP Indicator Premium/Discount  Key Levels, image 4
Trading product for Multi VWAP Indicator Premium/Discount  Key Levels, image 5
Trading product for Multi VWAP Indicator Premium/Discount  Key Levels, image 6
Trading product for Multi VWAP Indicator Premium/Discount  Key Levels, image 7
Since 18/01/2026
18
Sales

Description

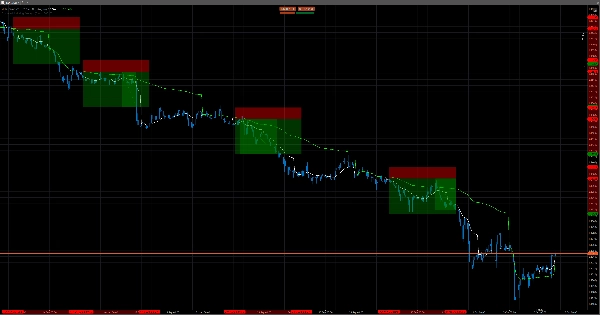
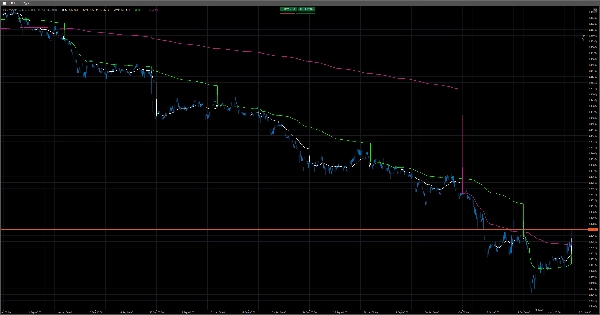
Multi VWAP - Three VWAPs, Three timeframes, One clean chart. Your Essential Trading Tool.

Multi VWAP puts the Daily, Weekly and Monthly volume-weighted average price on a single chart and tells you the moment the market crosses a level that matters. No clutter, no lag, no second-guessing where real value sits.


Multi VWAP is a lightweight, highly customizable, all-in-one volume-weighted average price indicator built for traders who use dynamic VWAP as a decision tool, not just a line. It runs three independent VWAP engines side by side so you can read short-term, swing and macro value at a glance:

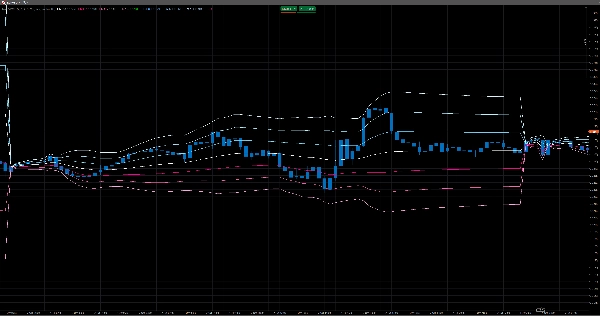
  • Daily VWAP β€” the institutional intraday benchmark, with three volume-weighted Οƒ-bands for mean-reversion and stretch zones.
  • Weekly VWAP β€” a stronger, higher-timeframe value shelf, also with three Οƒ-bands.
  • Monthly VWAP β€” a clean macro reference line for the biggest picture.

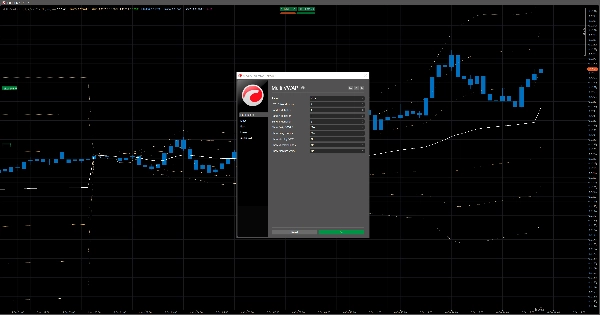
Session-accurate resets. A UTC-offset setting (default +2) shifts when each period restarts, so your Daily, Weekly and Monthly VWAPs roll over on your session β€” not midnight UTC.

Statistically correct bands. The Β±1/Β±2/Β±3 bands use true volume-weighted variance (not a plain price standard deviation), so each envelope reflects where volume actually traded around the mean. All three band multipliers are adjustable.

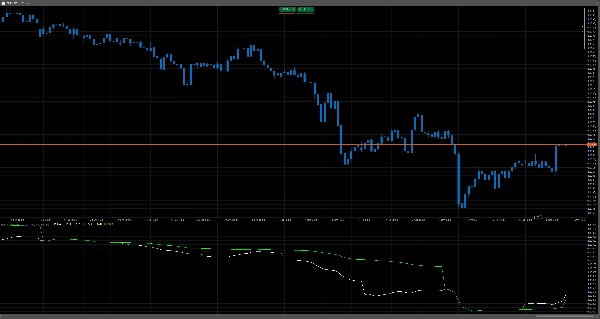
VWAP Cross in a Panel. For those who like a clean chart you can show the VWAP crosses in a panel below the chart

Genuinely lightweight. Everything is calculated with running cumulative sums β€” no heavy look-back loops. Anything you hide isn't computed: turn a timeframe's bands off and the variance and square-root math simply don't run; turn a whole timeframe off and it's skipped entirely without having to run calculations in the background.

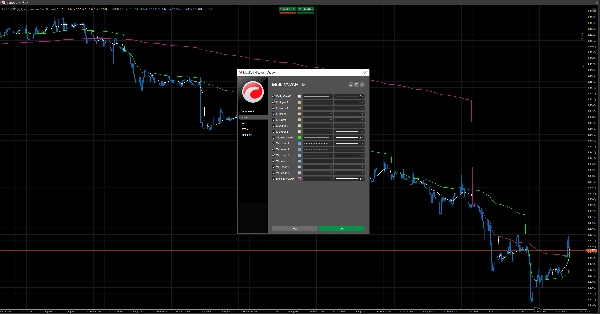
Fully modular. Independent Yes/No controls for every line and every band set, plus cTrader's native per-line visibility β€” so you can run it as a minimalist single-VWAP tool or a full three-timeframe value map, and switch between them in seconds.


Who this is for

Multi VWAP is built for intraday and swing traders who trade around value β€” anyone who uses VWAP as a fair-value anchor rather than a lagging average:

  • Day traders who fade or ride moves off the Daily VWAP and its Οƒ-bands, and want to know the instant price stretches to a 3rd-band extreme.
  • Swing traders who treat the Weekly and Monthly VWAPs as higher-timeframe support/resistance shelves and watch for cross confirmations between timeframes.
  • Mean-reversion traders who need statistically meaningful bands to define overextension, not arbitrary offsets.
  • Multi-timeframe traders who want short-, medium- and long-term value on one chart instead of stacking three indicators.


Works on any instrument and any chart timeframe in cTrader. Because it reads tick volume, it's equally at home on FX, indices, metals and crypto CFDs.


Summary

Indicator profile
Indicator category
Volume
Output type
Visualisation
Data requirements
Bars only
Supported signals
Cross
Breakout
Level touch
Reversal
Session opening range

Customer reviews

0.0
Reviews: 0
Customer reviews
No reviews for this product yet. Already tried it? Be the first to tell others!

Discussion

FAQ

Premium/Discount
Key Levels
Volume
Supply & Demand
Channel
VWAP
Support & Resistance
Products available through cTrader Store, including trading bots, indicators and plugins, are provided by third-party developers and made available for informational and technical access purposes only. cTrader Store is not a broker and does not provide investment advice, personal recommendations or any guarantee of future performance.

More from this author

Indicator
BOS
Volume
+5
The Volume Delta Indicator using Institutional Level 2 DOM Data, The Edge Institutions Pay Millions For, now on cTrader
cBot
Volume
XAUUSD
+5
The Black Box Bot v2 is out. A New Revolution. Make up to 750% per year on Gold m5.
Indicator
Volume
Key Levels
+5
Volume Profile Pro - A Lightweight and Highly Customizable Side & Range Volume Profile

You may also like

Indicator
Prop
Forex
+5
Higher TimeFrame Candle Tracker: Current Timeframe (Any TimeFrame) Show High TimeFrame Candle Bar
Indicator
RSI
Stochastic
+2
Composite mean-reversion oscillator merging Z-Score, RSI & Bollinger %B into one clear overbought/oversold signal.
Indicator
ATR
Prop
+14
Optimize exits with Chandelier Exit! Visualize stop-loss points dynamically for improved trading precision and safety.
Indicator
ADX
ATR
+2
GOLD SENTINEL v1.0 - A CANDLE-COLORING INDICATOR FOR GOLD.
Indicator
RSI
Indicator Stochastic With RSI
Indicator
AI
Forex
+5
Whale Hunting Indicator
Indicator
Doji
Volume
+5
Instantly spot high-liquidity institutional moves with clean, non-obtrusive triangle alerts on cTrader charts.
Indicator
Prop
Forex
+13
Decision System Indicator According to Cosmic Laws
Indicator
Prop
Forex
+7
The Parabolic SAR, or "Stop and Reverse," is a dynamic technical analysis tool.
Indicator
Drawdown Monitor
Proprietary trading desk risk monitoring dashboard!
Indicator
AI
SMC
+11
Perfect Entry Price designed to help traders identify the most accurate and reliable price levels for market entries
Indicator
Forex
EURUSD
+4
A precision overlay tool that combines session-aware VWAP logic and standard deviations.
Indicator
ATR
RSI
+7
Track the Movement of Market Assets with an Oscillator Scanner in Real-Time!
Indicator
Forex
BTCUSD
+7
πŸš€ TMAX RBA Indicator - The Ultimate Multi-Timeframe Momentum System πŸš€
Indicator
RSI
RSI on the main chart with 45/55 momentum levels, overbought/oversold levels, averaged RSI, and multi-timeframe support.
Indicator
ATR
Prop
+13
Enhance trading with ATR Bands! Visualize market volatility using dynamic upper and lower ATR bands for precise decision
Indicator
Laser entries with pivot confirmation. No repaint, all timeframes. Professional results.
Indicator
ATR
BOS
+5
Clean Smart Money zones with filtered FVGs, confirmed BOS, Order Blocks, and automatic mitigation tracking.

Price

Since 18/01/2026
18
Sales