
Description
https://chartshots.spotware.com/c/695be69b1a3ca
https://chartshots.spotware.com/c/695be2a98e848
https://chartshots.spotware.com/c/695be7e8e88fa
https://chartshots.spotware.com/c/695be31346fe7
https://chartshots.spotware.com/c/695be3bd18aea
https://chartshots.spotware.com/c/695be5d5687c7
Auto Chart Patterns
📊 WHAT IS IT?
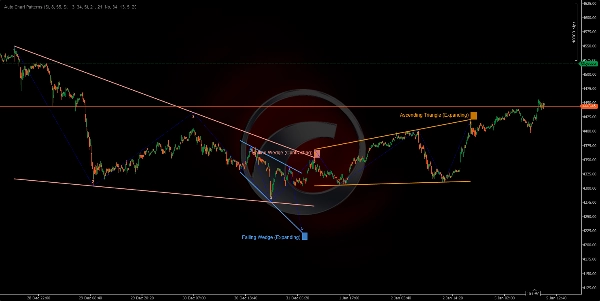
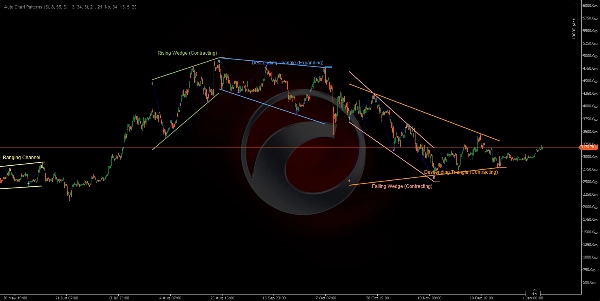
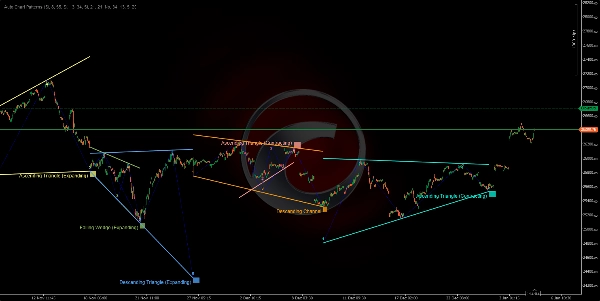
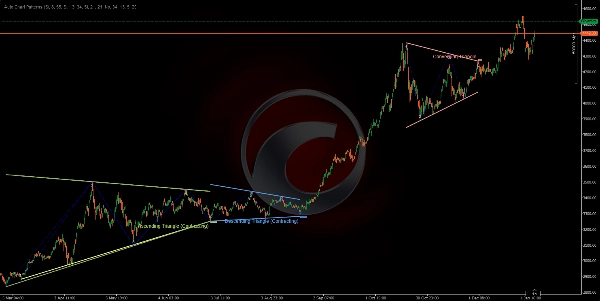
The Auto Chart Patterns indicator is an advanced geometric formation scanner that automatically detects and visualizes classical chart patterns using multi-timeframe swing point analysis. It identifies 14 different geometric formations including channels, wedges, and triangles by connecting swing highs and lows with trend lines, creating a comprehensive pattern recognition system.
🎯 WHAT IS IT FOR?
This indicator helps traders to:
- Automatically detect 14 classic chart patterns (channels, wedges, triangles) 📐
- Identify potential breakout zones before they occur ⚡
- Visualize market structure through geometric price relationships 🔍
- Trade continuation and reversal patterns with visual confirmation ✅
- Filter patterns by trend direction and final pivot type 🎛️
- Analyze multiple swing timeframes simultaneously for confluence 🌊
🔍 HOW DOES IT WORK?
Swing Point Detection System 📍
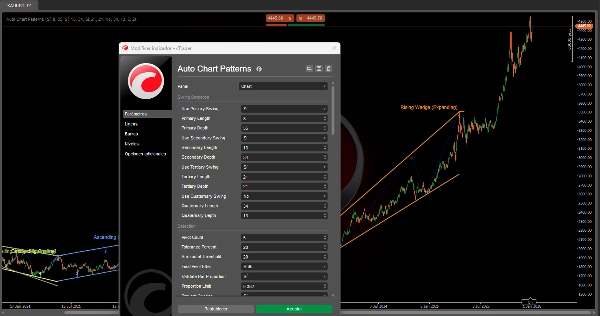
The indicator uses up to four independent swing detectors running simultaneously, each with configurable sensitivity:
- Detection Logic:
- Monitors price highs and lows over a rolling window (Period).
- Identifies local peaks (swing highs) and troughs (swing lows).
- Confirms swings only after a minimum depth requirement is met (prevents noise).
- Swing High: Price makes the highest high in the Period, then falls for
MinDepthbars. - Swing Low: Price makes the lowest low in the Period, then rises for
MinDepthbars.
- Four Swing Layers:
- Primary Swing (Default: Length 8, Depth 55) - Long-term structure 🔵
- Secondary Swing (Default: Length 13, Depth 34) - Medium-term structure 🟢
- Tertiary Swing (Default: Length 21, Depth 21) - Short-term structure 🟡
- Quaternary Swing (Default: Disabled) - Custom timeframe 🟣
Each detector can be enabled/disabled independently to focus on specific market structures.
Pattern Formation Process 🎨
STEP 1 - PIVOT COLLECTION:
- The system collects the 5 or 6 most recent swing points from any active detector.
- Points must alternate between highs and lows (zigzag structure).
- Example 5-point: High → Low → High → Low → High.
STEP 2 - TREND LINE CONSTRUCTION:
- Separates pivots into upper points (swing highs) and lower points (swing lows).
- Draws two trend lines: upper boundary and lower boundary.
- For 3-point boundaries: Tests 3 combinations (0-2, 0-1, 1-2) and selects the best fit ⭐
- Validates that trend lines don't penetrate candle bodies (only wicks allowed).
- Calculates a fit score: lines must touch < 20% of bars between pivots.
STEP 3 - GEOMETRIC ANALYSIS:
- Measures the angle relationship between the upper and lower boundaries.
- Determines if the formation is Expanding (widening), Contracting (narrowing), or Parallel (constant width).
- Identifies trend direction: Upward, Downward, or Neutral (horizontal).
- Classifies into one of the 14 formation types based on geometry.
STEP 4 - VALIDATION & FILTERING:
- Bar Proportion Check: Ensures swing spacing is proportional (prevents distorted patterns) ✅
- Overlap Prevention: Blocks new patterns that conflict with existing ones 🚫
- Duplicate Check: Prevents redrawing the same pattern.
- Final Pivot Filter: Only shows patterns ending with a specified pivot direction (Up/Down/Both).
- Formation Type Filter: Enables/disables specific pattern categories.
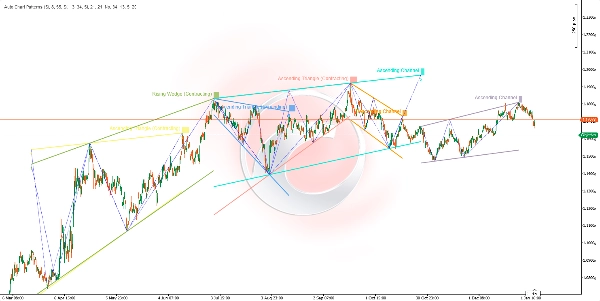
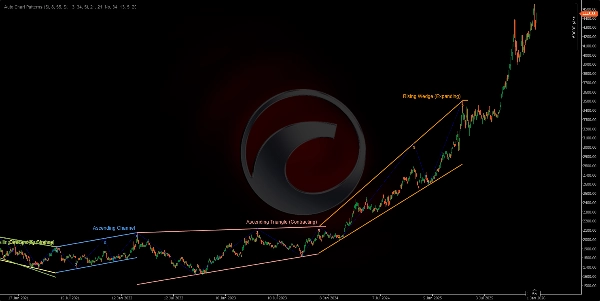
STEP 5 - VISUALIZATION:
- Draws upper and lower boundary lines in vibrant colors from a 12-color palette 🎨
- Optionally displays zigzag swing lines connecting pivots (dotted blue).
- Shows pivot numbers (1, 2, 3, 4, 5) at each swing point.
- Labels the formation with the pattern name at the final pivot.
- Color-codes the background behind the label for clarity.
📐 THE 14 DETECTED FORMATIONS
CHANNELS (Parallel Formations) 📦
- Ascending Channel (Upward Parallel) 📈
- Both boundaries slope upward at a similar angle.
- Indicates a bullish continuation trend.
- Trade: Buy at the lower boundary, sell at the upper boundary.
- Descending Channel (Downward Parallel) 📉
- Both boundaries slope downward at a similar angle.
- Indicates a bearish continuation trend.
- Trade: Sell at the upper boundary, buy at the lower boundary.
- Ranging Channel (Lateral/Horizontal) ↔️
- Both boundaries are nearly horizontal.
- Indicates consolidation or indecision.
- Trade: Range-bound strategy, buy support/sell resistance.
EXPANDING WEDGES (Broadening Formations) 📣
4. Rising Wedge (Expanding) ⚠️
* Both boundaries slope upward, with a widening gap.
* Bearish reversal pattern - price losing upward momentum.
* Trade: Wait for lower boundary break, enter short.
5. Falling Wedge (Expanding) ⚠️
* Both boundaries slope downward, with a widening gap.
* Bullish reversal pattern - price losing downward momentum.
* Trade: Wait for upper boundary break, enter long.
6. Diverging Triangle (Broadening Triangle) 🔺
* Upper boundary slopes up, lower boundary slopes down.
* High volatility expansion pattern.
* Trade: Extremely risky, wait for a clear directional break.
7. Ascending Triangle (Expanding) 📊
* Upper boundary horizontal, lower boundary slopes up.
* Bullish continuation with an expanding range.
* Trade: Buy upper boundary breakout.
8. Descending Triangle (Expanding) 📊
* Lower boundary horizontal, upper boundary slopes down.
* Bearish continuation with an expanding range.
* Trade: Sell lower boundary breakdown.
CONTRACTING WEDGES (Converging Formations) 🔻
9. Rising Wedge (Contracting) 🔺
* Both boundaries slope upward, with a narrowing gap.
* Bearish reversal pattern - bullish exhaustion ⚠️
* Trade: Short on lower boundary break.
10. Falling Wedge (Contracting) 🔻
* Both boundaries slope downward, with a narrowing gap.
* Bullish reversal pattern - bearish exhaustion ⚠️
* Trade: Long on upper boundary break.
CONTRACTING TRIANGLES (Consolidation Formations) △
11. Converging Triangle (Symmetric Triangle) ⚖️
* Upper boundary slopes down, lower boundary slopes up at a similar rate.
* Neutral consolidation - continuation pattern.
* Trade: Wait for breakout direction, trade accordingly.
12. Descending Triangle (Contracting) 📐
* Lower boundary horizontal (support), upper boundary slopes down.
* Bearish continuation pattern 🔴
* Trade: Short on support break with volume.
13. Ascending Triangle (Contracting) 📐
* Upper boundary horizontal (resistance), lower boundary slopes up.
* Bullish continuation pattern 🟢
* Trade: Long on resistance break with volume.
14. Invalid/Unknown ❌
* Patterns that don't meet geometric criteria.
* Filtered out automatically.
Summary
Key functionalities include identifying potential breakout zones, visualizing market structure through geometric price relationships, and supporting trading of continuation and reversal patterns with visual confirmation. Users can filter detected patterns by trend direction, pivot type, and formation category. The indicator prevents overlapping and duplicate patterns to maintain clarity.
The 14 detected formations cover a range of classical patterns such as ascending, descending, and ranging channels; expanding and contracting wedges; and various triangle types (converging, diverging, ascending, descending). Visual outputs include color-coded boundary lines, pivot numbering, zigzag swing lines, and labeled pattern names for easy interpretation. This tool supports analysis across multiple markets including Forex, stocks, commodities, indices, and cryptocurrencies.
Customer reviews
5 | 50 % | |
4 | 50 % | |
3 | 0 % | |
2 | 0 % | |
1 | 0 % |


