Indicator
RSI
Breakout
XAUUSD
ATR
Commodities
Supertrend
Crypto
BTCUSD
Auto-Trend Channel
"Auto-Trend Channel" logo
4.4
25/07/2025
1957
Desktop
"Auto-Trend Channel" uploaded image"Auto-Trend Channel" uploaded image"Auto-Trend Channel" uploaded image"Auto-Trend Channel" uploaded image

Pinescriptlabs Store indicators:                        Pinescriptlabs  Store cBots :  (cBot) Gold & BTC BreakoutSession Pivots(new)


Advanced Market Structure: Bos, Choch, SwinLevels, Order Blocks,  Market Structure & Liquidity Finder (New)

ZigZag Price Liquidity Projection

Trailing Smart Algorithm (new)

S&R Structural ZigZag                                

ZigZag

 BOS & CHOCH

Zones Supply Demand

Leverage Liquidation Map

Auto-Trend Channel


Volume POC Heatmap


PREMIUM SSL CHANNEL

Prediction Based on Linreg & ATR

 ICT Power of 3 
                                                   

SmartTrend Support &
Resistance
Lines
       

Fair Value Gap Sessions                


RSI Trend Trigger

Channel Breakout System

Supertrend

Market Imbalance

Adaptive Trend Channel 

Dynamic
Market Structure
Analysis
of
Turning
Points

Order Block

Fibonacci
Linear
Regression
Multi-timeframe

Dynamic RSI

Momentum Fair Value Gap

Market Flow Projection

Dynamic Trend Gradient

Multi-Level
Candle Bias
Tracker

Zig-Zag Extremity Tracker

Reactive Moving Average

Auto
Support and
Resistance
Trend
Lines

All
Support and
Resistance
Levels

Dynamic Range Momentum

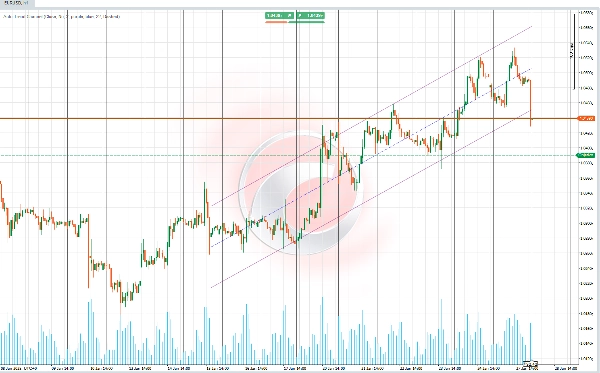
📊 Auto-Trend Channel 📊

This indicator plots a trend channel based on the calculation of linear regression and the standard deviation of price data (logarithmic) for a period selected automatically. 📈 The period is determined using the Pearson correlation coefficient (RRR), choosing the one with the highest absolute value. 🧮

Main Functionality

The primary functionality is to compute a trend channel that automatically adapts to the most representative period length, using advanced statistics to define support, resistance, and the central trend line.
The channel includes:
1️⃣ A baseline representing the calculated linear trend.
2️⃣ Upper and lower lines defining the channel bands at a distance proportional to the standard deviation.

🚀 Features and Calculations 🚀

🔎 Optimal Period Calculation

  • The indicator evaluates multiple data periods (short or long, depending on configuration) to find the one with the most accurate correlation to market behavior.
  • The Pearson correlation is used as the key metric to identify the period with the strongest relationship between historical price and the generated trend line.

📐 Linear Regression and Price Projection

  • For each evaluated period, a regression line is calculated based on the natural logarithm of prices to stabilize extreme variations.
  • Key components of the calculation include:
    • Slope: Represents the rate of price change.
    • Intercept: The starting point of the projected line.
    • Mean: Establishes a reference baseline.

📊 Standard Deviation and Channel Limits

  • The standard deviation of prices relative to the regression line is calculated.
  • The upper band (resistance) and lower band (support) are derived by adjusting the central line with a user-configurable standard deviation multiplier.

🌈 Trend Channel Visualization

  • The channel is composed of three main elements:
    • Central Line: Shows the main trend based on the regression line.
    • Upper Line: Represents the channel’s upper limit (resistance), adjusted by standard deviation.
    • Lower Line: Represents the channel’s lower limit (support), adjusted by standard deviation.
  • Users can customize the channel's colors, transparency, and line styles for better visual clarity.

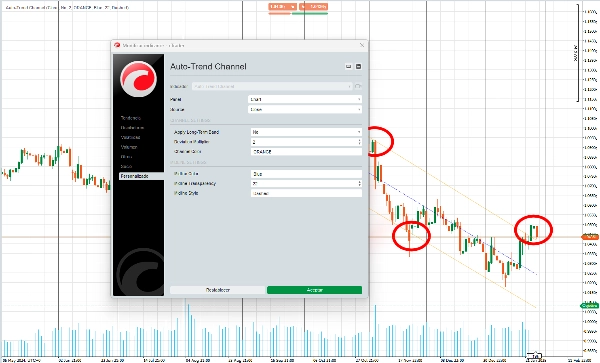
🎛️ Adaptability and Configuration

  • Users can personalize various aspects of the indicator, such as:
    • The colors of the lines and the channel.
    • Whether to focus on long periods (macro trends) or short periods (micro trends).
  • This adaptability ensures the indicator suits different trading styles and visual preferences.

🔍 Use :

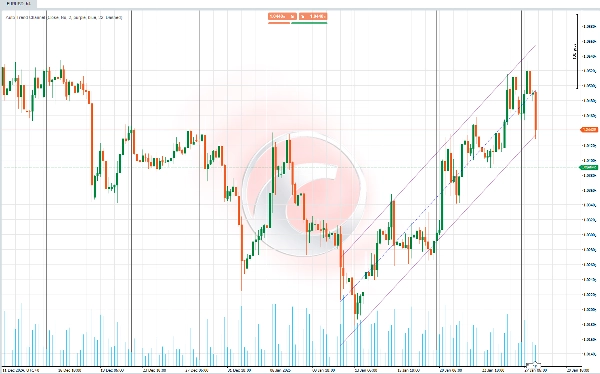
1️⃣ Trend Identification

  • The channel’s central line helps determine whether the market is in an uptrend, downtrend, or sideways trend.

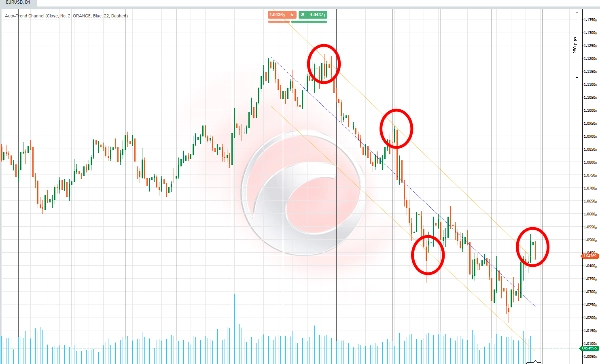
2️⃣ Dynamic Support and Resistance

  • The upper and lower channel lines act as potential zones where the price may reverse or consolidate.

3️⃣ Consolidation and Breakout Detection

  • Prices staying within the channel suggest consolidation, while a breakout indicates a trend change or a strong price movement.

4️⃣ Adjustment to Different Trading Styles

  • Long periods are useful for identifying general trends and making strategic decisions in broader timeframes.
  • Short periods allow traders to capture faster movements and respond to immediate market changes.


4.4
Reviews: 5
5
60 %
4
20 %
3
20 %
2
0 %
1
0 %
Customer reviews
October 1, 2025
It works great and definitely helpful to track market behaviour to make more accurate decisions. Thank you!
August 10, 2025
Helpful, thanks :)
July 9, 2025
Pros: Automatically detects and draws clear trend channels; adaptive to changing market conditions; easy setup and stable performance. Cons: No alerts on breakout or retest; lacks ability to disable channels per timeframe; can't save custom templates.
May 19, 2025
well done man, great work on this.
May 6, 2025
Thank its amazing. i usually trade trends. 5 star for u, be niicer if u add multitimeframe or periods like 50periods etc.
More from this author
Indicator
RSI
Breakout
XAUUSD
+6
ZigZag
ZigZag filters noise, spots trends, patterns, pivots, aiding analysis, trade management, and confirmations. 📉📈
Indicator
RSI
Breakout
XAUUSD
+6
Order Block
Identify bullish and bearish Order Blocks to spot key support/resistance levels and potential trend reversals! 📈🔄
Indicator
RSI
Breakout
XAUUSD
+5
Zones Supply Demand
📊Zones Supply & Demand: Identifies key price levels with high volume concentration, marking Supply/Demand Zones & Marke
Indicator
RSI
XAUUSD
Breakout
+5
BOS & CHOCH
Market structural patterns , specifically the concepts of Change of Character (ChoCH) 🔄 and Break of Structure (BoS) 💥
Indicator
RSI
Breakout
XAUUSD
+6
Volume POC Heatmap
📊 Shows volume by price levels, highlights POC, and key zones. Identifies dynamic support/resistance and imbalances.
Indicator
RSI
Breakout
Supertrend
All Support and Resistance Levels
"Identify key market zones and visualize support/resistance from multiple timeframes on a single chart.
Indicator
RSI
Breakout
XAUUSD
+6
Fair Value Gap Sessions
identify and highlight temporary market inefficiencies known as "fair value gaps" 🚨 within specific trading Sessions.
Indicator
RSI
Breakout
XAUUSD
+5
Supertrend
💹 Define a price channel 📈 and determine trend direction (bullish 🟢 or bearish 🔴).
Indicator
Indices
RSI
XAUUSD
+7
RSI Divergence
Detects bullish and bearish divergences
Indicator
RSI
Breakout
XAUUSD
+4
Dynamic Market Structure Analysis of Turning Points
Identify market structure effortlessly with swing highs, lows, CHoCH, and BOS levels for smart trading decisions! 📊🔍"
Indicator
RSI
Breakout
XAUUSD
+4
Multi-Level Candle Bias Tracker
Price direction by calculating the probability of reaching new highs/lows. Shows levels & stats📈
Indicator
RSI
Breakout
Supertrend
Trend Heikin Multi MA
🚀 TrendHeikinMultiMA: Advanced trend detection using Heikin-Ashi smoothing & MAs! Eliminates noise, confirms real trend
Indicator
RSI
Breakout
Supertrend
Market Trend OB
Price action to detect when the market changes trend (MSB) and defines, order blocks , ZigZag etc.📊
Indicator
RSI
Breakout
Supertrend
Leverage Liquidation Map
📊 Liquidation Map: Potential areas where highly leveraged investors might face liquidations.
Indicator
RSI
Breakout
Supertrend
Swing Levels
🔍 Automatically detect support and resistance levels based on "swings" or pivots
Advanced Market Structure Bos,Choch,SwinLevels, Order Blog
Advanced price action tool that combines multiple technical analysis concepts
Indicator
RSI
XAUUSD
Breakout
+4
ICT Power of 3
🎯 Auto-plots key zones (Accumulation, Manipulation, Distribution) . Reveals institutional traps & trends.
Indicator
RSI
Breakout
Supertrend
Zig-Zag Extremity Tracker
Dynamically adjusts regression channels based on ZigZag extremes, resetting when price breaks bands to track real trends
You may also like
KDJ
The KDJ oscillator display consists of 3 lines (K, D and J - hence the name of the display) and 2 levels.
Indicator
RSI
Breakout
XAUUSD
+4
SmartTrend Support & Resistance Lines
🚀 Auto-detects support/resistance & trend channels! Saves time ⏳, spots key levels 🔍
Indicator
RSI
Breakout
XAUUSD
+5
Supertrend
💹 Define a price channel 📈 and determine trend direction (bullish 🟢 or bearish 🔴).
Indicator
NAS100
Indices
Breakout
+7
ORB Range with FVGs
This indicator plots the 15m opening range of the NY session with the first N FVGs presented on the chart after the open
LaguerreRSI
Laguerre RSI: smoother, faster RSI with less noise. Great for spotting reversals and timing entries.
E7 Harmonic Structures Basic
E7 Harmonic Structures Basic.
Indicator
RSI
Breakout
XAUUSD
+5
Shielded Trend
Buy/Sell signals filtering noise, color-coded trends & strength shield 🛡️. Trade only with POWER ⚡
VegaXLR - Chart Patterns Alerts
Enhance your trading strategy with automated detection and alerts for key chart patterns.
Indicator
NAS100
NZDUSD
XAUUSD
+11
Samurai Breakout Lite
⚔️Limited version. Draws clean session box (Tokyo / London / New York / Overlap) and optional breakout plan (EP/TP/SL)⚔️
Indicator
NAS100
NZDUSD
XAUUSD
+7
Bayesian Price Projection Model
Bayesian theory** to forecast a future price while providing **uncertainty ranges** that represent upper and lower bound
Market_Session_Forex
Market Sessions
Candles_Painter
Overlay HTF context on any chart: color bars by HTF and draw filled HTF bodies with optional High/Low lines.
Indicator
NAS100
RSI
NZDUSD
+19
SMC + FVG Binary Signal Pro
SMC/ICT signals using FVG + liquidity sweep/MSS with EMA-RSI-MACD filters, clear visuals, and actionable alerts.
Indicator
Signal
FairValueGap-PremiumVersion1
This Fair Value Gap (FVG) indicator is a technical analysis on multi-timeframe.
Indicator
NAS100
NZDUSD
Martingale
+26
Volume Bubble
Volume Bubbles is a lightweight yet powerful visual indicator for cTrader
IR Moving MTF
multi time frame moving averge. you could choose different type of price like median ,high and ... and differnt type of
Indicator
Signal
Scalping
Major Tops and Bottoms
Average accuracy of around 60% to 70% on 45min timeframes it is highly recommended to use stop losses
Indicator
RSI
Breakout
XAUUSD
+4
Multi-Level Candle Bias Tracker
Price direction by calculating the probability of reaching new highs/lows. Shows levels & stats📈