PinBarCandlestickPattern
Indicator
310 downloads
Version 1.0, Mar 2025
Windows, Mac
5.0
Reviews: 1
Description
Pin Bar Detector – Indicator Description
The Pin Bar Detector identifies bullish and bearish pin bars, which are strong reversal candlestick patterns often used in price action trading.
How It Works
1️⃣ Detects Small Body Candles
- The candle's body must be ≤ 25% of the total range (customizable).
2️⃣ Measures Wick Lengths
- Bullish Pin Bar (Hammer):
- Small body near the top of the range.
- Long lower wick (≥ 60%) of the candle’s total length.
- Bearish Pin Bar (Shooting Star):
- Small body near the bottom of the range.
- Long upper wick (≥ 60%) of the candle’s total length.
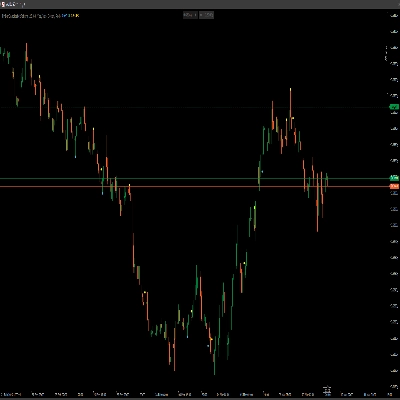
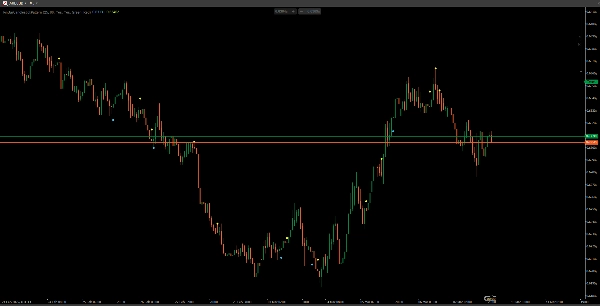
3️⃣ Plots Buy/Sell Signals
- Green dot below a bullish pin bar.
- Red dot above a bearish pin bar.
Key Features
✅ Detects bullish and bearish reversals with customizable parameters.
✅ Works on any timeframe and market (Forex, Stocks, Crypto).
✅ Helps traders spot high-probability reversals at key support & resistance levels.
📌 Best Use: Combine with trend analysis, support/resistance, and volume for better confirmation! 🚀
Summary
AI summary
The PinBarCandlestickPattern indicator detects bullish and bearish pin bar candlestick patterns, which are commonly used in price action trading as strong reversal signals. It identifies candles with small bodies (≤ 25% of the total range, customizable) and measures wick lengths to classify pin bars: bullish pin bars have a small body near the top and a long lower wick (≥ 60% of candle length), while bearish pin bars have a small body near the bottom and a long upper wick (≥ 60%). The indicator plots green dots below bullish pin bars and red dots above bearish pin bars to signal potential buy or sell opportunities. It supports any timeframe and market, including Forex, Stocks, and Crypto. The tool is designed to help traders spot high-probability reversals at key support and resistance levels and can be combined with trend analysis, volume, and other technical factors for enhanced confirmation.
Indicator profile
Customer reviews
5.0
Reviews: 1
5 | 100 % | |
4 | 0 % | |
3 | 0 % | |
2 | 0 % | |
1 | 0 % |
Customer reviews
August 18, 2025
Pros: Automatically detects bullish and bearish Pin Bars with volume filtering and visual alerts. Integrates Telegram, pop‑up and audio alerts. Multi‑TF support.
Discussion
FAQ
Forex
Crypto
Stocks
Products available through cTrader Store, including trading bots, indicators and plugins, are provided by third-party developers and made available for informational and technical access purposes only. cTrader Store is not a broker and does not provide investment advice, personal recommendations or any guarantee of future performance.


Price
Since 21/02/2025
466.3M
Traded volume
180.83K
Pips won
22
Sales
6.91K
Free installs