

WeTrades Liquidity Swings
Indicator
297 downloads
Version 1.0, Apr 2026
Windows, Mac

4.02K
Free installs
Description
Liquidity Swings
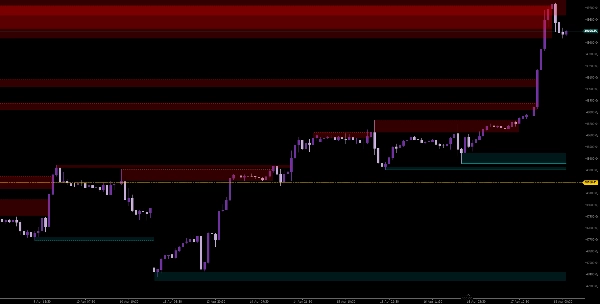
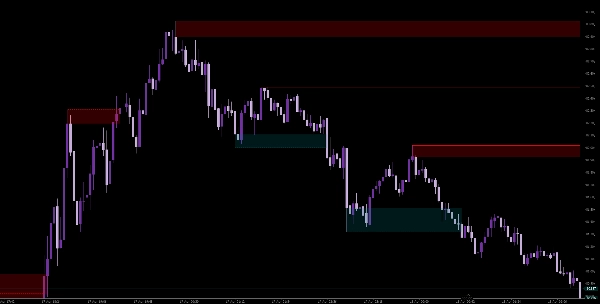
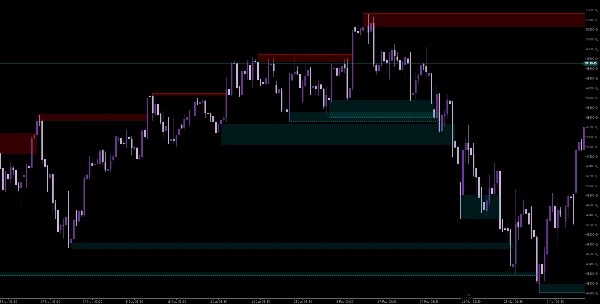
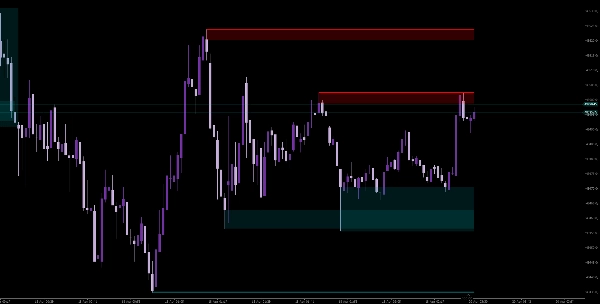
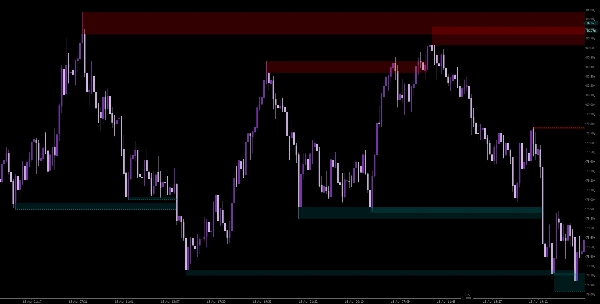
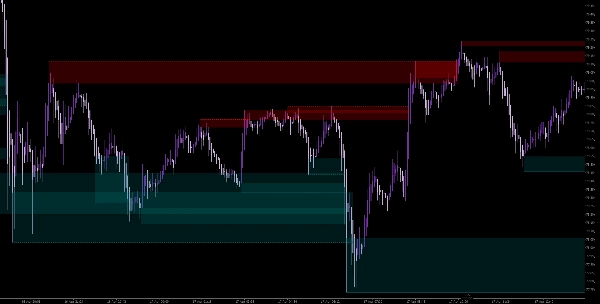
Liquidity Swings is a precision tool designed to identify and visualize key liquidity zones formed around swing highs and lows. Built for traders who focus on market structure, this indicator highlights areas where price is likely to react, reverse, or break with momentum.
Key Features
- Automatic Swing Detection
Identifies pivot highs and lows using a configurable lookback period. - Liquidity Zones Visualization
Displays zones based on: - Wick extremities (precision entries)
- Full candle range (broader liquidity areas)
- Touch Count Tracking
Counts how many times price interacts with each zone, helping you gauge strength and significance. - Break Confirmation
Clearly marks when a liquidity level is broken with a confirmed close beyond the level. - Dynamic Chart Objects
Zones and levels extend in real time and update only on confirmed candles for accuracy. - Customizable Appearance
- Separate colors for highs and lows
- Adjustable zone opacity
- Optional display of swing highs/lows
- Performance Optimized
Efficient handling of chart objects with a configurable limit on stored levels.
How It Helps You Trade
- Identify liquidity pools where stops are likely resting
- Spot rejection zones for potential reversals
- Confirm breakouts with structure-based validation
- Improve entry precision using repeated touches
Best Use Cases
- Smart Money Concepts (SMC)
- Liquidity-based trading strategies
- Support & Resistance refinement
- Breakout and retest setups
Parameters
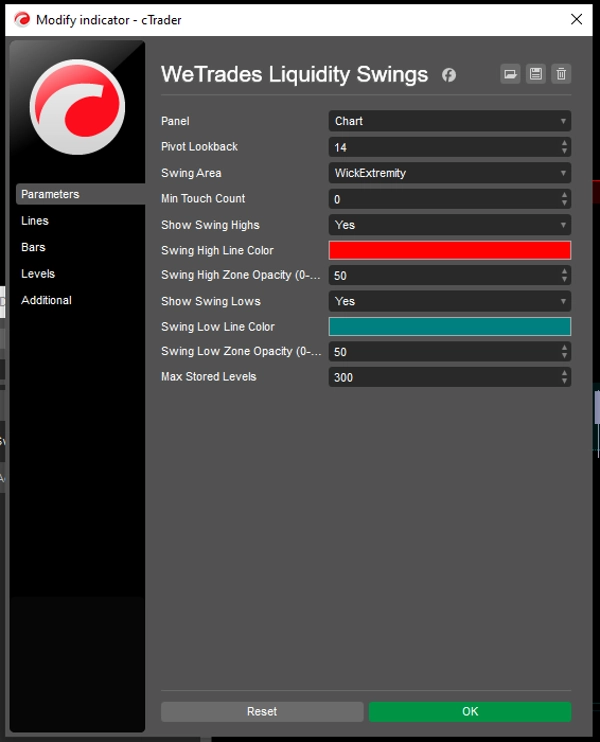
- Pivot Lookback – Defines swing sensitivity
- Swing Area Mode – Wick or full range
- Min Touch Count – Filter weaker levels
- Max Stored Levels – Control chart clutter
Summary
AI summary
WeTrades Liquidity Swings is a technical indicator designed to identify and visualize key liquidity zones around swing highs and lows on price charts. It automatically detects pivot points using a configurable lookback period and highlights liquidity zones based on either wick extremities for precise entries or full candle ranges for broader areas. The indicator tracks how many times price touches each zone, aiding in assessing their strength, and confirms breaks by marking when price closes beyond a liquidity level. Zones dynamically extend in real time and update only on confirmed candles to maintain accuracy. Users can customize the appearance with separate colors for highs and lows, adjustable opacity, and optional swing point display. The tool is optimized for performance with limits on stored levels to reduce chart clutter. It supports trading approaches focused on Smart Money Concepts, liquidity-based strategies, refined support and resistance, and breakout/retest setups. Parameters include pivot lookback sensitivity, swing area mode, minimum touch count filter, and maximum stored levels. This indicator provides visual structure clarity to help traders identify liquidity pools, rejection zones, confirm breakouts, and improve entry precision.
Indicator profile
Indicator category
Support & resistance
Output type
Visualisation
Data requirements
Bars only
Supported signals
Breakout
Reversal
Level touch
Level break
Session opening range
Discussion
Customer reviews
0.0
Reviews: 0
Customer reviews
No reviews for this product yet. Already tried it? Be the first to tell others!
FAQ
Key Levels
MSS
Market Structure
Support & Resistance
Products available through cTrader Store, including trading bots, indicators and plugins, are provided by third-party developers and made available for informational and technical access purposes only. cTrader Store is not a broker and does not provide investment advice, personal recommendations or any guarantee of future performance.
More from this author





























Price
4.02K
Free installs