
Repiptor BB Colored Width
Indicator
156 downloads
Version 1.0, Oct 2024
Windows, Mac
5.0
Reviews: 1
Description
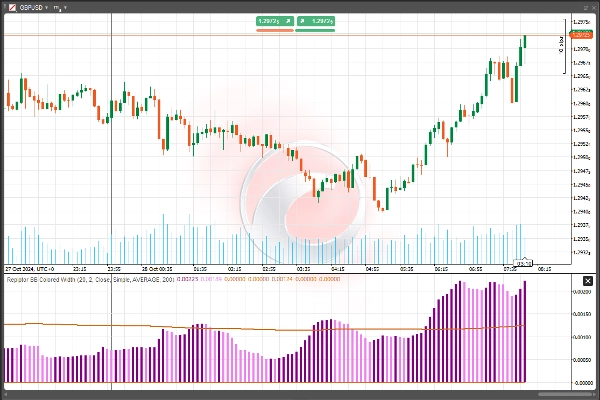
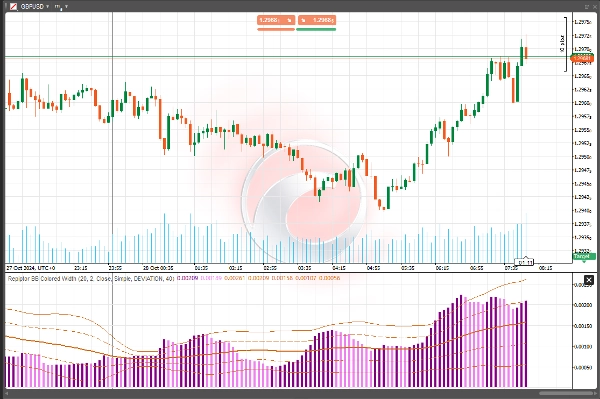
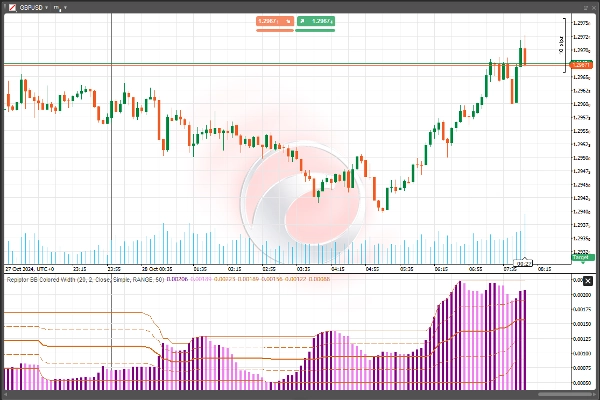
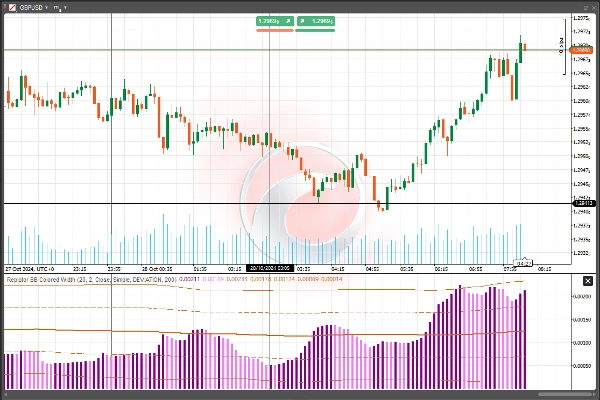
Colored Bollinger Bands width with four alternative dynamic levels:
- Average
- Median
- Deviation
- Range
Darker color = volatility up, Lighter Color = volatility down
Summary
AI summary
Repiptor BB Colored Width is a technical indicator that visualizes the width of Bollinger Bands with color coding to represent volatility changes. It offers four dynamic measurement levels for the Bollinger Bands width: Average, Median, Deviation, and Range. The indicator uses color intensity to indicate volatility trends—darker colors signify increasing volatility, while lighter colors indicate decreasing volatility. This tool helps traders assess market volatility visually by highlighting changes in the Bollinger Bands width on their charts.
Indicator profile
Customer reviews
5.0
Reviews: 1
5 | 100 % | |
4 | 0 % | |
3 | 0 % | |
2 | 0 % | |
1 | 0 % |
Customer reviews
August 18, 2025
Clear volatility visualization, customizable, lightweight. Cons: No alerts, no MTF mode, lacks integrated breakout signals.
Discussion
FAQ
Bollinger
Products available through cTrader Store, including trading bots, indicators and plugins, are provided by third-party developers and made available for informational and technical access purposes only. cTrader Store is not a broker and does not provide investment advice, personal recommendations or any guarantee of future performance.
More from this author


Price
Since 26/10/2024
1.18K
Free installs