Brokers & props
For business
00
Days
:
00
Hours
:
00
Minutes
:
00
Seconds
Indicator
Bollinger
Repiptor BB Width
03/09/2025
79
Desktop
Since 26/10/2024
Free installs
1010
"Repiptor BB Width" uploaded image"Repiptor BB Width" uploaded image

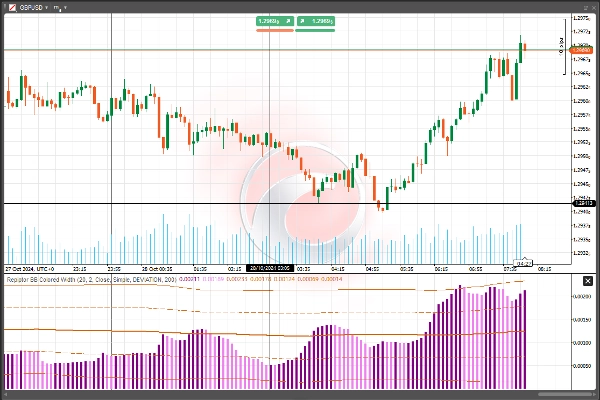
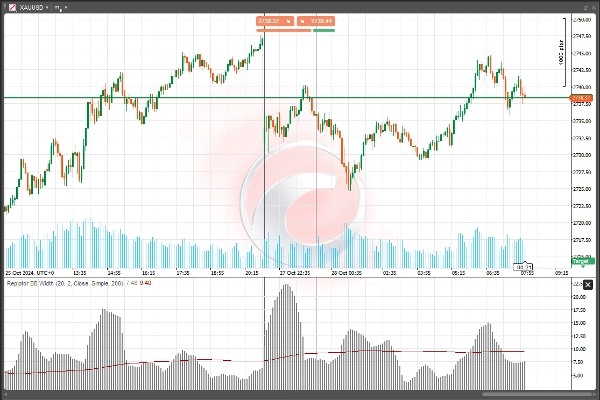
Bollinger Bands Width with dynamic average level

0.0
Reviews: 0
Customer reviews
No reviews for this product yet. Already tried it? Be the first to tell others!
More from this author
Repiptor Candlescope Lite
Candlestick pattern detector lite version
Repiptor RSI Amplified
RSI Amplified
Indicator
Bollinger
Repiptor BB Colored Width
Colored Bollinger Bands Width
You may also like
Indicator
NAS100
NZDUSD
XAUUSD
+11
HKTrading Free ZigZag
Lightweight ZigZag tool for clear structure, swing highs/lows and liquidity-based analysis.
xhobaniFX_ADR-Lines
xhobaniFX_ADR-Lines: Average Daily Range Horizontal Lines
VegaXLR - Auto Support and Resistance
cTrader Auto Support & Resistance detects key levels with Fibonacci analysis and sends real-time trading alerts.
Indicator
Indices
Breakout
XAUUSD
+3
AnchoredVWAP
A precision overlay tool that combines session-aware VWAP logic and standard deviations.
Candelstick xxl
The indicator is designed to detect aggressive movements in the market and without volume for trend changes.
Indicator
NAS100
XAUUSD
Commodities
+11
WHT AIRRA
Indicator that auto-calculates SL/TP via volatility. 3 layers: digital filtering, recursive Bayes, adaptive factor
Indicator
Grid
NAS100
NZDUSD
+6
Volume Break Structure
🎯Identify zones of HIGH INSTITUTIONAL INTEREST: Where there is MORE VOLUME in the breaks, there is GREATER PARTICIPAT..
Daily SD Levels - Indicator
Plots intraday VWAP and dynamic ±1/±2 standard deviation (SD) bands based on current day’s price and volume.
Indicator
NAS100
Indices
Breakout
+7
ORB Range with FVGs
This indicator plots the 15m opening range of the NY session with the first N FVGs presented on the chart after the open
Indicator
NAS100
NZDUSD
XAUUSD
+13
MACD Crossover PRO
Customize the MACD! Choose colors, get real-time tick updates, and see crossover points for enhanced trading precision.
High TF Plotter
Captra High TF Plotter visualizes high timeframe Bar on lower timeframe charts, highlighting with bull/bear colors.
Indicator
Grid
NAS100
RSI
+21
Market Cipher B
Market Cipher B
Larry Williams 9.1
Larry Williams 9.1
Moving Average channel
This indicator is designed to display customizable moving averages (MAs) on a chart.
Indicator
Breakout
Stocks
Signal
Darvas Box
The Darvas Box involves identifying "boxes" or trading ranges where a stock's price consolidates before breaking out.
zh-cn Variety Period time panel(multilanguage)
This indicator can be used to: change color, shape size, position, change font, increase or decrease, and other function
Indicator
RSI
Breakout
XAUUSD
+5
Supertrend
💹 Define a price channel 📈 and determine trend direction (bullish 🟢 or bearish 🔴).
Indicator
RSI
XAUUSD
Breakout
+6
Market Imbalance
Identifies market imbalances and visually marks key areas based on price patterns and volatility (ATR).