Description
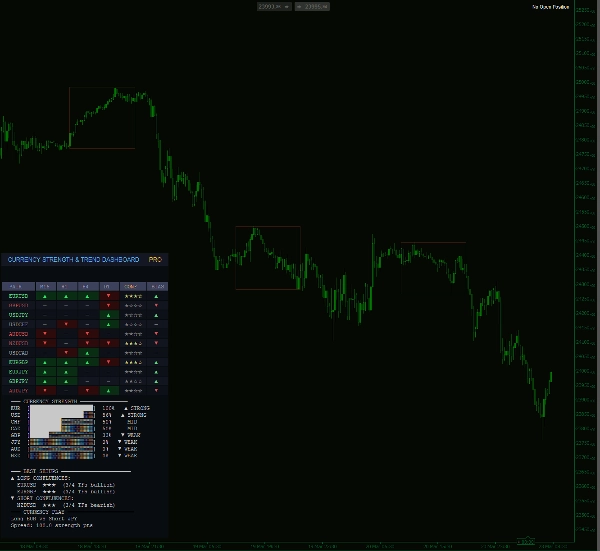
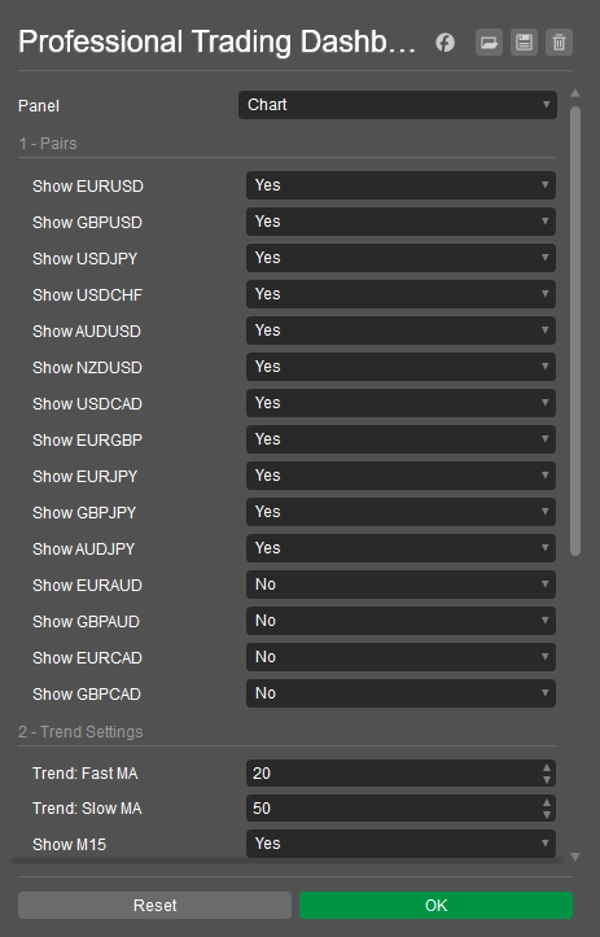
Currency Strength & Trend Dashboard brings the one tool serious forex traders rely on — and cTrader has never had — directly to your charts. Load it on any chart and it instantly scans up to 15 currency pairs across five timeframes simultaneously, giving you a complete picture of market structure without opening a single additional window.
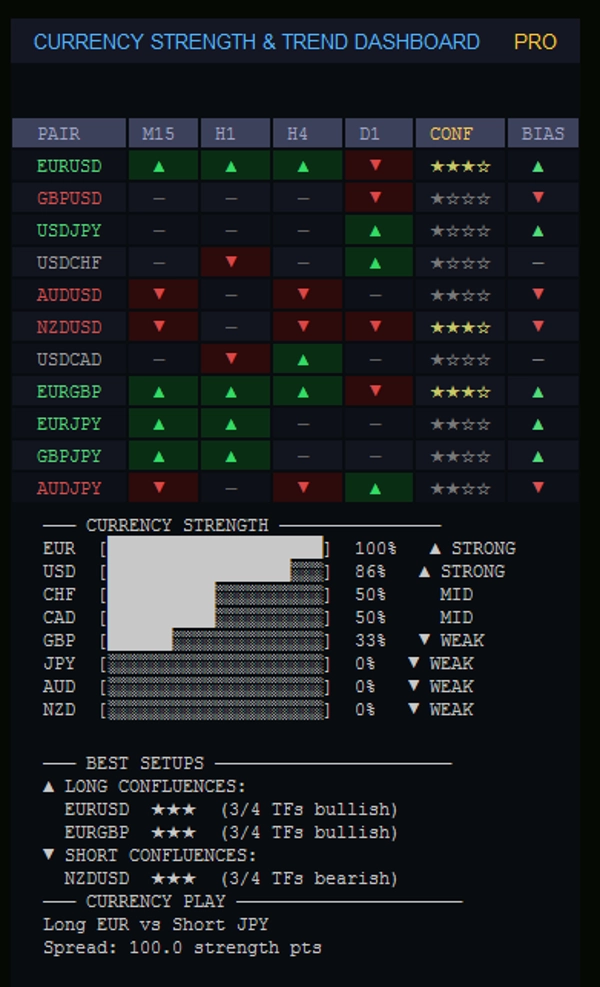
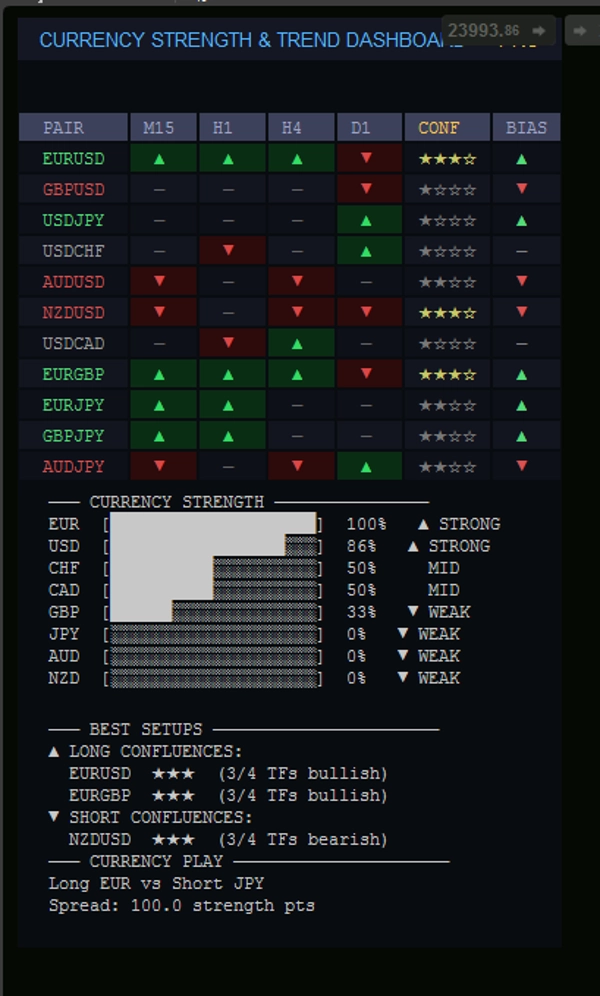
The heatmap grid colour-codes every pair and timeframe at a glance. Green means uptrend, red means downtrend, grey means no clear bias. A confluence star rating shows how many timeframes agree on a direction — five stars means every timeframe is aligned. The overall bias arrow gives you the immediate read: long, short, or wait.
A live currency strength section ranks all eight major currencies from strongest to weakest with a percentage score and visual bar. The strongest versus weakest pairing is identified automatically as the logical trade of the session. A best setups panel surfaces the highest-confluence pairs so you never have to scan manually.
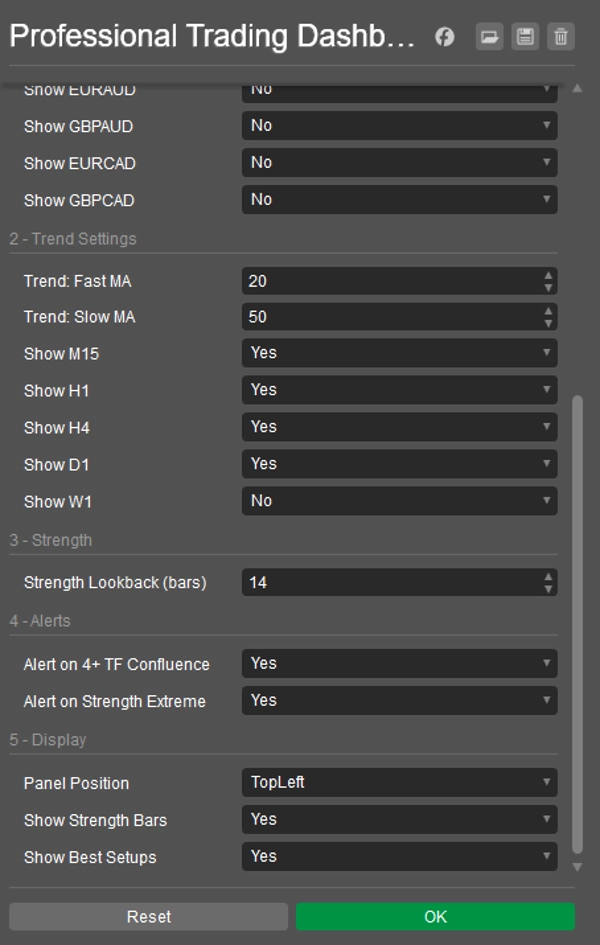
Alerts fire when four or more timeframes align on a single pair, and when any currency reaches an extreme strength reading. Everything updates bar by bar, automatically, on any chart you attach it to.
Summary
Additionally, the dashboard ranks the eight major currencies by strength with percentage scores and visual bars. It automatically identifies the strongest versus weakest currency pairs as logical trade opportunities. A best setups panel highlights pairs with the highest confluence to streamline decision-making. Alerts notify users when four or more timeframes align on a pair or when any currency reaches an extreme strength level. The dashboard updates automatically on each new bar and can be loaded on any chart within cTrader, consolidating multiple analytical tools into one interface for efficient forex trading analysis.
Customer reviews
5 | 100 % | |
4 | 0 % | |
3 | 0 % | |
2 | 0 % | |
1 | 0 % |