
Description
Advanced Trend Dynamics with Oscillator Bollinger Bands
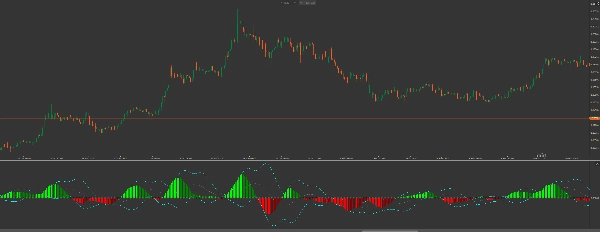
The Squeeze Pro: Momentum & Volatility Suite is an institutional-grade toolkit for cTrader. Unlike standard indicators, this suite provides a dual-layer analysis of market behavior: it identifies the Squeeze Phase (market compression) and monitors Momentum Extremes using Bollinger Bands calculated directly on the oscillator itself.
Key Innovations
- Momentum Bollinger Bands: The first of its kind. By applying BBs to the momentum histogram, you can identify "overbought" or "oversold" momentum levels—perfect for timing exits before the trend exhausts.
- Three-State Squeeze Detection:
- Black Dots (Squeeze On): High compression. The market is "coiling" for a massive breakout.
- Gray Dots (Squeeze Off): Volatility is expanding. The move has started.
- Blue Dots (No Squeeze): Normal market conditions.
- Linear Regression Smoothing: Uses a refined
CalculateLinearRegressionalgorithm to filter out price noise, providing a smooth, reliable histogram. - Dual-Overlay Logic: Operates in a separate indicator window to keep your price chart clean while providing deep analytical insights.
Visual Intelligence Guide:
- The Histogram (Trend & Strength)
- Lime: Bullish momentum is accelerating (Strong Buying).
- Green: Bullish momentum is slowing down (Profit Taking).
- Red: Bearish momentum is accelerating (Strong Selling).
- Maroon: Bearish momentum is slowing down (Sellers Exhausted).
- The Oscillator Bands (The "Cyan" Lines)
- When the histogram bars push outside the Cyan Bollinger Bands, the current trend is at a statistical extreme. Look for reversals or major pullbacks when the histogram begins to retreat back inside these bands.
Trading Strategy: The "Power Breakout"
- Identify the Squeeze: Wait for Black Dots to appear on the zero line. This indicates the "calm before the storm."
- Confirm the Direction: Look for the first Lime (Buy) or Red (Sell) histogram bar.
- The Trigger: Enter the trade when the Squeeze Off (Gray dot) appears, signaling the release of energy.
- The Exit: Take profits when the histogram changes from Lime to Green, OR when the histogram reaches the Oscillator Upper BB, signaling exhaustion.
Why Upgrade to Squeeze Pro?
While basic indicators show you where the price went, Squeeze Pro shows you the pressure behind the move. By seeing the squeeze and the momentum bands simultaneously, you avoid entering trends that are already exhausted and catch the explosive moves that others miss.
Developer Note: This indicator is highly optimized for cTrader’s API, ensuring zero performance lag even on lower-end machines while handling complex linear regression calculations in real-time.
Summary
Key features include linear regression smoothing to reduce price noise, a dual-overlay display that keeps the price chart uncluttered, and a color-coded histogram that visually represents bullish and bearish momentum strength and changes. When histogram bars move outside the oscillator’s Bollinger Bands (cyan lines), it signals statistically extreme momentum levels, useful for timing entries and exits.
The indicator supports a "Power Breakout" trading strategy: traders wait for squeeze signals, confirm momentum direction via histogram colors, enter trades on squeeze release, and exit when momentum shows signs of exhaustion. This suite provides institutional-grade insights into trend pressure and momentum dynamics, helping traders identify potential explosive moves and avoid exhausted trends.
Customer reviews
5 | 0 % | |
4 | 100 % | |
3 | 0 % | |
2 | 0 % | |
1 | 0 % |


