
Description
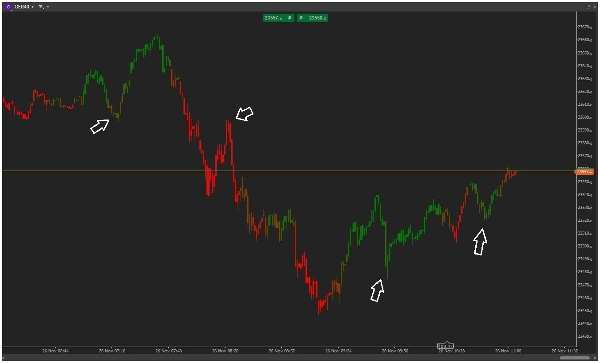
Candles Volume Delta is a powerful, visually intuitive indicator that transforms raw tick volume into actionable trading insights. By coloring price bars based on buy/sell volume pressure, it provides an immediate visual cue of market sentiment and strength, helping you spot potential trend continuations or reversals with just a glance.
Key Features
- 🟢 Visual Volume Analysis: Colors each price bar based on buy/sell volume dominance
- 📊 Smart Delta Calculation: Calculates volume delta over a user-defined period
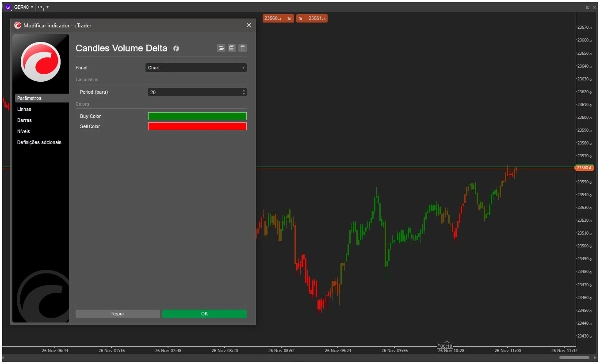
- 🎨 Customizable Colors: Fully adjustable buy/sell color schemes
- ⚡ Real-time Processing: Optimized for instant visual feedback on new bars
- 🛠️ Easy Setup: Simple configuration with sensible defaults
How It Works
Candles Volume Delta analyzes tick volume over your specified period (default: 20 bars) and calculates the percentage of buy volume versus sell volume:
- Green Bars: High buying pressure (typically >60% buy volume)
- Red Bars: High selling pressure (typically <40% buy volume)
- Gradient Colors: Smooth color transitions show intermediate strength levels
The indicator uses ATR-based smoothing to ensure stable, meaningful signals that adapt to current market volatility.
Trading Applications
- Trend Confirmation: Validate trend strength with volume confirmation
- Reversal Signals: Spot potential reversals when price action contradicts volume flow
- Breakout Validation: Confirm breakouts with supporting volume evidence
- Market Sentiment: Gauge overall buyer/seller dominance in any timeframe
Why Candles Volume Delta?
Unlike complex volume indicators that clutter your chart, Candles Volume Delta provides immediate visual feedback through simple color coding. It's lightweight, fast, and gives you the essential volume information you need without overwhelming data.
Perfect for traders who want:
- Quick market sentiment assessment
- Clean, non-cluttered chart analysis
- Visual confirmation of price movements
- Easy integration into existing strategies
Install today and see the markets through the lens of volume dynamics!
Summary
Key features include customizable color schemes, real-time processing for instant visual feedback, and easy setup with sensible defaults. The indicator helps traders quickly assess market sentiment, confirm trends, identify potential reversals, validate breakouts, and gauge buyer/seller dominance across timeframes. It is designed to provide essential volume insights without cluttering the chart, making it suitable for integration into various trading strategies, including scalping and trend analysis. Supported markets include indices and other instruments where volume analysis is relevant.
Customer reviews
5 | 100 % | |
4 | 0 % | |
3 | 0 % | |
2 | 0 % | |
1 | 0 % |


!["[CB] Pivot Points Pro" logo](https://cdn.ctrader.com/image/webp/43463c82-67b0-4f10-a4ba-901bba091d81_32594)


