
Stochastic Momentum Index
Indicator
1 purchases
Version 2.1, Jan 2026
Windows, Mac
4.5
Reviews: 2
Description
Stochastic Momentum Index (SMI) is a refined stochastic oscillator designed to measure momentum more smoothly than a classic Stochastic. This cTrader implementation matches the commonly used TradingView formulation by applying double EMA smoothing to both the relative range and the high–low range, producing a clean, stable momentum curve that works well across trending and ranging conditions.
What it shows
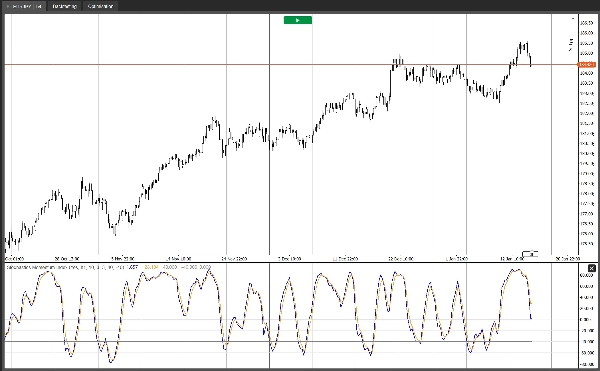
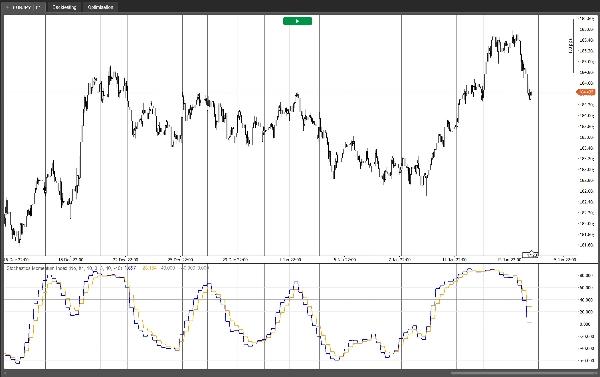
- The SMI measures where the close sits relative to the midpoint of the recent high–low range, normalized and scaled.
- Values tend to oscillate between -100 and +100.
- Overbought/oversold reference levels (default +40 / -40) help identify stretched conditions and momentum extremes.
Plots
- SMI: the main momentum line.
- SMI-based EMA: a signal line (EMA of SMI) for crossovers and confirmation.
- Overbought / Oversold / Middle (0) levels for quick visual context.
How traders use it
- Trend regimes: Use the 0-line as a directional filter (above 0 = bullish pressure, below 0 = bearish pressure) and trade pullbacks via SMI vs signal-line crossovers in the direction of the trend.
- Mean-reversion regimes: Fade extremes when SMI returns from overbought/oversold and confirms with a crossover, often targeting the 0-line as the first mean-reversion objective.
- Divergences: Momentum divergence between price and SMI can highlight potential weakening swings.
Multi-timeframe option
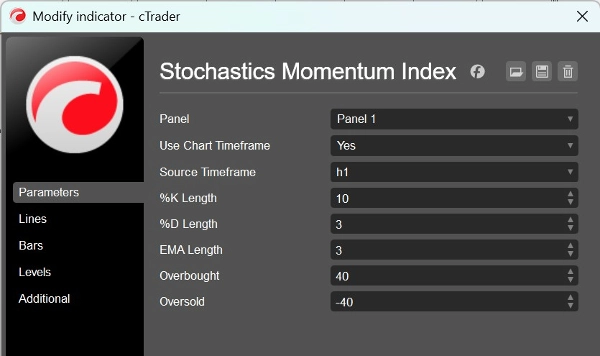
- Select a Source Timeframe to calculate SMI from a higher timeframe while displaying it on the current chart (ideal for filtering noise and improving signal quality).
- Or enable Use Chart Timeframe to keep calculations on the current timeframe.
Inputs
- %K Length: lookback window for highest high / lowest low.
- %D Length: smoothing length used in the double-EMA calculation.
- EMA Length: signal line length (EMA of SMI).
- Overbought / Oversold: reference levels.
- Use Chart Timeframe / Source Timeframe: optional higher-timeframe calculation.
This indicator is built to be lightweight, stable, and practical for real trading workflows—whether you trade trend continuation, ranges, or use SMI as a confirmation filter within a broader strategy.
Summary
AI summary
The Stochastic Momentum Index (SMI) indicator for cTrader is a refined momentum oscillator that applies double EMA smoothing to both the relative range and high–low range, producing a smooth and stable momentum curve. It measures the position of the close price relative to the midpoint of the recent high–low range, with values oscillating between -100 and +100. Default overbought and oversold levels are set at +40 and -40, respectively, to highlight momentum extremes.
The indicator plots three key elements: the main SMI momentum line, an EMA-based signal line for crossovers and confirmation, and reference levels for overbought, oversold, and the zero midpoint. Traders use the zero line as a directional filter to identify bullish or bearish pressure and trade pullbacks via SMI and signal line crossovers. It also supports mean-reversion strategies by signaling fades from overbought/oversold conditions and can highlight momentum divergences.
A multi-timeframe option allows calculation of the SMI from a higher timeframe while displaying it on the current chart, helping to filter noise and improve signal quality. User inputs include lookback lengths for %K and %D, signal line EMA length, overbought/oversold levels, and timeframe selection. The indicator is designed for use across various markets including Forex, stocks, commodities, indices, and cryptocurrencies.
Indicator profile
Customer reviews
4.5
Reviews: 2
5 | 50 % | |
4 | 50 % | |
3 | 0 % | |
2 | 0 % | |
1 | 0 % |
Customer reviews
January 28, 2026
The part worth keeping is the workflow feels calmer, and 2 swing checks is the line to watch.
January 23, 2026
it earns a spot because weak entries have a harder time slipping through, and spread and slippage need a line in the notes.
Discussion
FAQ
BTCUSD
Forex
Signal
Breakout
Indices
EURUSD
Commodities
GBPUSD
NZDUSD
Prop
Scalping
Crypto
Stocks
XAUUSD
NAS100
USDJPY
Products available through cTrader Store, including trading bots, indicators and plugins, are provided by third-party developers and made available for informational and technical access purposes only. cTrader Store is not a broker and does not provide investment advice, personal recommendations or any guarantee of future performance.
More from this author


!["High-Low Divergence [Iridio Capital]" logo](https://cdn.ctrader.com/image/webp/443c4661-7abb-40f1-842f-4b6ec560649b_40914)


!["[Hamster-Coder] Bollinger Bands" logo](https://cdn.ctrader.com/image/webp/21d8e5d6-fb11-4bac-b9ee-cd05c2b76804_30327)


Price
Since 31/01/2025
414.53M
Traded volume
2.69M
Pips won
4
Sales
187
Free installs