RegressionChannelV2
Indicator
Version 1.0, Jan 2026
Windows, Mac
5.0
Reviews: 1
Description
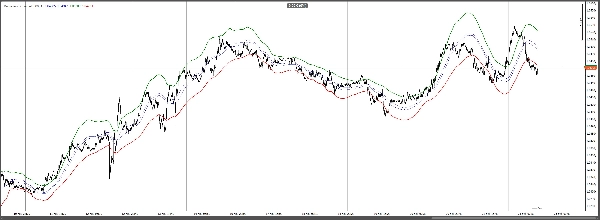
Regression Channel is a visual trend-and-volatility tool that draws a smooth channel around price. It calculates adaptive upper and lower boundaries based on recent market behavior, helping you quickly spot the prevailing direction, measure volatility expansion/contraction, and identify potential overextended moves.
Use it to:
- Confirm trend direction and strength
- Highlight mean-reversion zones near the channel edges
- Spot breakouts when price pushes beyond the boundary
- Improve entries/exits by combining with your existing signals
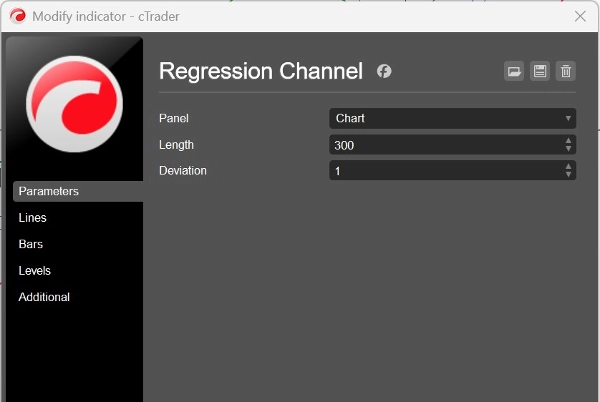
Parameters:
- Length: lookback window used for the channel calculation
- Deviation: band width multiplier controlling how tight or wide the channel is
Summary
Indicator profile
Customer reviews
5.0
Reviews: 1
5 | 100 % | |
4 | 0 % | |
3 | 0 % | |
2 | 0 % | |
1 | 0 % |
Customer reviews
January 24, 2026
Messy entries become more obvious, but the market context still matters.
Discussion
FAQ
BTCUSD
Forex
Signal
Breakout
Indices
EURUSD
Commodities
GBPUSD
NZDUSD
Prop
Scalping
Crypto
Stocks
XAUUSD
NAS100
USDJPY
Products available through cTrader Store, including trading bots, indicators and plugins, are provided by third-party developers and made available for informational and technical access purposes only. cTrader Store is not a broker and does not provide investment advice, personal recommendations or any guarantee of future performance.
More from this author


!["[Hamster-Coder] Bollinger Bands" logo](https://cdn.ctrader.com/image/webp/21d8e5d6-fb11-4bac-b9ee-cd05c2b76804_30327)


Price
Since 31/01/2025
414.06M
Traded volume
2.68M
Pips won
4
Sales
187
Free installs