
QX Heatmap Scanner
Indicator
5 purchases
Version 1.0, Dec 2025
Windows, Mac
4.3
Reviews: 3
Description
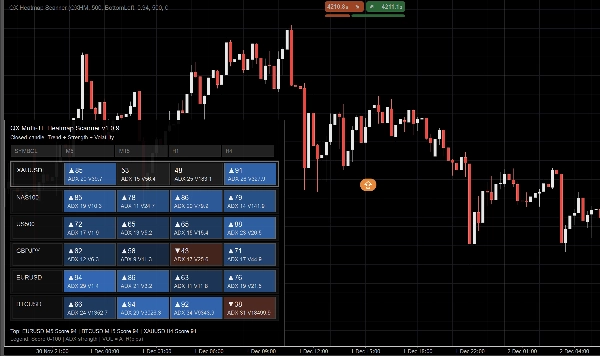
QX Heatmap Scanner is a compact, on-chart heatmap panel that helps you scan multiple symbols and timeframes in seconds. It summarizes market Direction, Strength, and Volatility into a clear per-cell score so you can prioritize the best conditions and avoid low-quality setups.
What you see
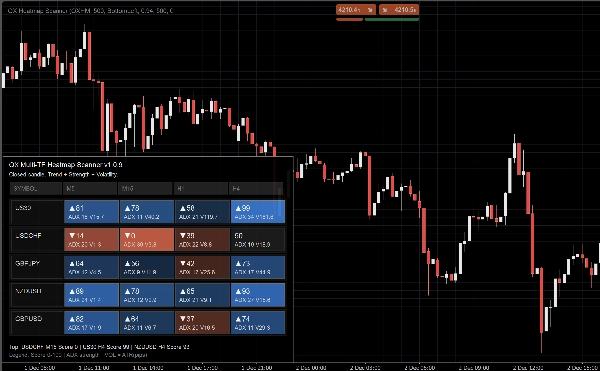
Each cell (Symbol × Timeframe) displays:
- Score (0–100) with directional marker (▲/▼ when biased)
- ADX value (strength context)
- VOL value (volatility context)
Color intensity reflects conviction. The layout stays readable even with many timeframes.
Display modes
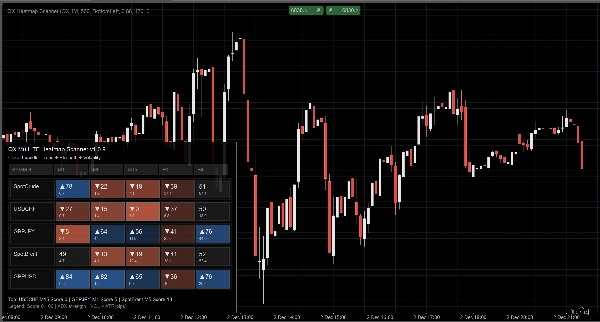
- Auto: adapts to available cell width
- Full: maximum detail
- Compact: optimized for more timeframes while keeping ADX and VOL visible
- Minimal: ultra-tight layout for small screens
Why it helps
- Faster top-down context before entries
- Quick cross-market comparison without opening many charts
- Cleaner decision-making by highlighting stronger conditions
Performance and stability
- Designed to update on closed candles for cleaner signals and lower noise
- Update Throttle (ms) to control CPU usage
- Defensive handling for missing symbols or insufficient data
Main features
- Multi-symbol, multi-timeframe heatmap panel
- Score 0–100 per cell with clear direction cues
- ADX and VOL displayed consistently
- Adjustable panel corner, width, opacity, and fonts
- Color customization (bull/bear/neutral + intensity range)
Key parameters
Symbols (CSV), Timeframes (CSV), Display Density, Panel Width/Corner/Opacity, Show VOL, Font Sizes, Update Throttle.
Note: This tool provides market context. It is not an auto-trading system and does not replace risk management.
Summary
AI summary
QX Heatmap Scanner is an on-chart indicator panel designed for multi-symbol and multi-timeframe market analysis. It provides a heatmap view that scores each symbol and timeframe combination from 0 to 100, reflecting market direction, strength, and volatility. Each cell displays a directional marker (up or down), ADX value for trend strength, and volatility (VOL) value, with color intensity indicating conviction level.
The panel supports various display modes—Auto, Full, Compact, and Minimal—allowing customization for different screen sizes and detail preferences. Users can adjust panel position, width, opacity, fonts, and color schemes for bullish, bearish, and neutral conditions.
QX Heatmap Scanner updates on closed candles to reduce noise and includes an update throttle feature to manage CPU usage. It handles missing symbols or insufficient data defensively to maintain stability.
Key features include quick top-down market context, cross-market comparison without multiple charts, and highlighting of stronger trading conditions. It supports symbols such as BTCUSD, EURUSD, GBPUSD, and markets including Forex, Crypto, Stocks, Commodities, and Indices. Parameters like symbols, timeframes, display density, and update throttle are user-configurable.
This tool provides market context to assist decision-making but does not execute trades or replace risk management.
Indicator profile
Customer reviews
4.3
Reviews: 3
5 | 33 % | |
4 | 67 % | |
3 | 0 % | |
2 | 0 % | |
1 | 0 % |
Customer reviews
December 6, 2025
Patient market filter for traders who monitor several markets or signals. It gives value around market monitoring, but too much information can distract without a process. It saves time if daily review drops from 15 minutes to under 10. The value is speed and clarity, not a trade signal by itself.
December 5, 2025
December 5, 2025
Clear setup tool for market monitoring. it keeps useful information closer to the trader, especially when used for reviewing conditions without jumping between views. The dashboard style makes 10 minute reviews easier, especially when checking 5 to 8 markets. The value is speed and clarity, not a trade signal by itself.
Discussion
FAQ
BTCUSD
Forex
Signal
Breakout
Indices
EURUSD
Commodities
GBPUSD
NZDUSD
RSI
Bollinger
Fibonacci
Scalping
Fair Value Gap
Crypto
Stocks
XAUUSD
NAS100
ATR
USDJPY
VWAP
Products available through cTrader Store, including trading bots, indicators and plugins, are provided by third-party developers and made available for informational and technical access purposes only. cTrader Store is not a broker and does not provide investment advice, personal recommendations or any guarantee of future performance.


Price
41.97M
Traded volume
208.53K
Pips won
14
Sales
363
Free installs