
QX MatrixHybrid
Indicator
Version 1.0, Feb 2026
Windows, Mac
4.6
Reviews: 3
Description
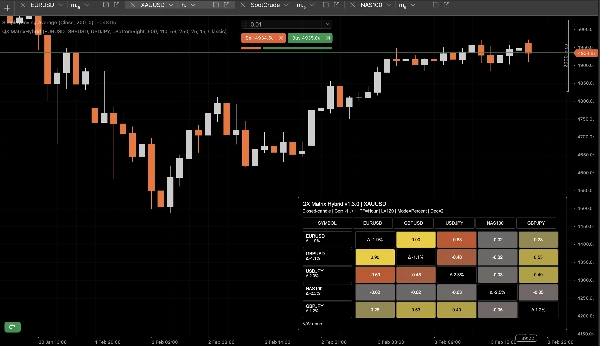
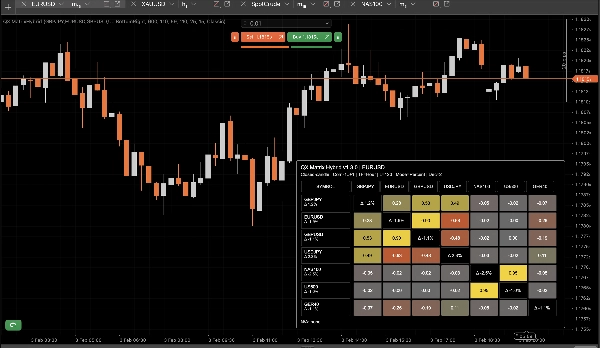
QX Matrix Hybrid is a visual indicator that displays a multi-asset correlation matrix as a clean heatmap panel. It helps you instantly identify which instruments move together, which move inversely, and where you may be unintentionally duplicating exposure across markets.
Key features
- Correlation matrix (-1 to +1) using Pearson correlation between symbols.
- Return Mode:
- Percent returns
- Log returns
- Strength (Δ%) per symbol: shows each symbol’s performance over the lookback window (in row labels and optionally on the diagonal).
- Auto text contrast: text color adapts to background luminance for readability.
- Themes + Custom palette: multiple presets plus full custom color picker controls.
- Flexible panel layout: corner docking, width, cell sizing, margins, row height control.
- Smart footer: lists missing/unavailable symbols with configurable truncation.
Performance & update logic
Built to stay responsive even with multiple symbols:
- Per-symbol caching of Symbol and Bars objects to avoid repetitive API calls.
- Automatic cache invalidation when Symbols CSV or TimeFrame changes.
- Closed Candle Only mode to minimize CPU load (updates on new closed bars).
- Optional Update Throttle (ms) for live mode.
How to use it
- +1.00: strong positive co-movement (high redundancy).
- 0.00: low relationship (potential diversification).
- -1.00: strong inverse relationship (possible hedge).
Use the matrix to reduce correlated overlap, find hedging pairs, and understand market “clusters” across FX, indices, metals, crypto, etc.
Parameters (high level)
- Symbols CSV, TimeFrame, Lookback
- Return Mode (Percent/Log), Decimals, Auto decimals on Log
- Closed Candle Only, Update Throttle
- Show Strength (Δ%), Show Footer, Footer Max Missing
- Panel layout (corner, width, cell sizes, margin)
- Colors / Theme (including Custom palette)
Notes
- Visualization only. No orders are placed.
- Symbols may show N/A if not available on your broker/server or if there isn’t enough history for the selected timeframe/lookback.
Summary
Indicator profile
Customer reviews
4.6
Reviews: 3
5 | 67 % | |
4 | 33 % | |
3 | 0 % | |
2 | 0 % | |
1 | 0 % |
Customer reviews
February 12, 2026
The part that matters is bad ideas get easier to avoid, and 20 signals is a fair first sample.
February 9, 2026
Two sessions say more than one clean chart, and weak ideas are easier to skip.
February 5, 2026
Ngl, weak ideas are easier to skip and that is enough to keep testing it. Price action still has to agree.
Discussion
FAQ
Signal
Indices
Commodities
GBPUSD
RSI
Bollinger
Fibonacci
Scalping
AI
XAUUSD
NAS100
MACD
BTCUSD
Forex
Breakout
EURUSD
NZDUSD
Martingale
Prop
ZigZag
Supertrend
Fair Value Gap
SMC
Crypto
Grid
Stocks
ATR
USDJPY
VWAP
Products available through cTrader Store, including trading bots, indicators and plugins, are provided by third-party developers and made available for informational and technical access purposes only. cTrader Store is not a broker and does not provide investment advice, personal recommendations or any guarantee of future performance.


Price
41.97M
Traded volume
208.53K
Pips won
13
Sales
344
Free installs