
Opis
QX RiskShield to kalkulator ryzyka na wykresie, który przelicza Twój stop distance na dokładny rozmiar pozycji (Jednostki i Loty), oraz poziomy cen SL/TP oparte na Twoich celach R:R. Został zaprojektowany do szybkiego podejmowania decyzji przy minimalnym zaśmieceniu wykresu.
To jest tylko wskaźnik. Nie składa zleceń.
Co widzisz:
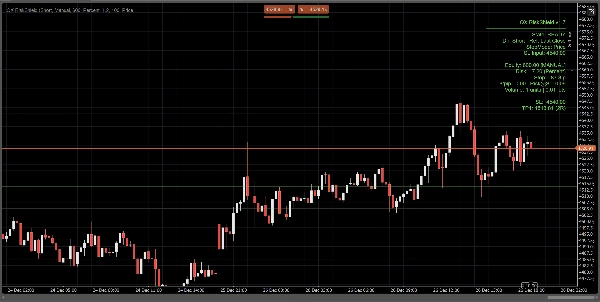
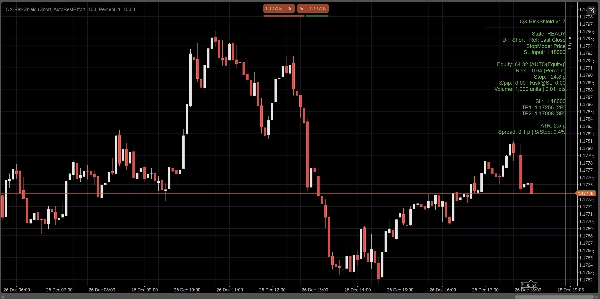
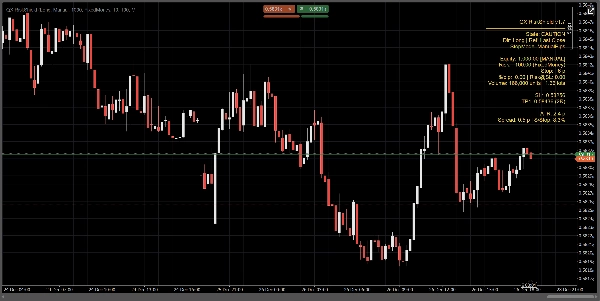
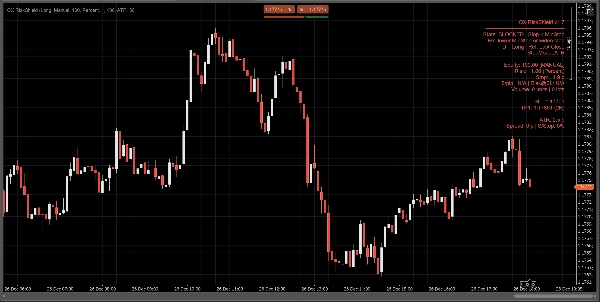
Kompaktowy panel pokazuje na pierwszy rzut oka:
- Stan: GOTOWY / UWAGA / ZABLOKOWANY
- Źródło kapitału: Ręczne lub Automatyczne (najlepsza próba, bezpieczny fallback)
- Kwota ryzyka: % kapitału lub stałe ryzyko pieniężne
- Odległość stopu: w pipsach
- Rozmiar pozycji: Jednostki + Loty (normalizowane do ograniczeń brokera)
- $/pip oraz Ryzyko@SL (szacowane ryzyko przy stopie)
- Poziomy cen SL / TP1 / TP2 (na podstawie Twoich celów RR)
- Opcjonalne linie wejścia / SL / TP na wykresie dla wizualnej referencji
Wszystkie obliczenia opierają się na ostatnim zamknięciu (stabilne, bez migotania wewnątrz świecy).
Tryby stopu:
Wybierz, jak definiowany jest Twój stop:
1) Ręczne pipsy
Ustaw stałą odległość stopu w pipsach.
2) Stop ATR
Odległość stopu = ATR(pipsy) × współczynnik ATR k.
Przydatne do dostosowywania rozmiaru pozycji do zmienności między symbolami.
3) Stop cenowy
Ustaw dokładną cenę SL (najlepsze dla handlu dyskrecjonalnego).
RiskShield przelicza tę odległość cenową na pipsy i odpowiednio dobiera rozmiar pozycji.
Logika stanu (bez zamieszania):
RiskShield używa jasnych stanów, aby użytkownicy od razu rozumieli, co się dzieje:
GOTOWY
Dane wejściowe są poprawne. Rozmiar pozycji jest dostępny.
UWAGA
Rozmiar jest poprawny, ale RiskShield wykrył ciasny stop w stosunku do ATR.
To ostrzeżenie, nie blokada.
ZABLOKOWANY
Rozmiar jest celowo wyłączony, gdy zasady są niebezpieczne lub nieprawidłowe, takie jak:
- Stop poniżej minimalnego progu stopu
- Cena SL po niewłaściwej stronie ceny referencyjnej
- Zbyt wysoki spread w stosunku do stopu (Spread/Stop %)
- Wolumen byłby poniżej minimalnego brokera
- Brak danych o pipsach/lotach symbolu
Może być wyświetlona krótka podpowiedź „Napraw” (opcjonalnie) do szybkiej korekty danych wejściowych.
Jak traderzy używają QX RiskShield (prosty przepływ pracy)
- Dołącz QX RiskShield do swojego wykresu.
- Wybierz kierunek handlu (Long lub Short).
- Wybierz swój typ ryzyka:
-
- Procent kapitału, lub
- Stałe ryzyko pieniężne na transakcję
- Wybierz tryb stopu:
-
- Ręczne pipsy, ATR lub cena SL
- Odczytaj wynik:
-
- Użyj Jednostek/Lotów do rozmiaru zlecenia
- Użyj poziomów SL/TP jako cen referencyjnych
- Jeśli panel pokazuje UWAGA, rozważ poszerzenie stopu lub użycie trybu ATR.
- Jeśli panel pokazuje ZABLOKOWANY, dostosuj dane wejściowe aż do stanu GOTOWY.
Opcje UI (zaprojektowane dla czystych wykresów):
- Tryb panelu: Prosty lub Profesjonalny
- Gęstość panelu: Normalna lub Kompaktowa (dla minimalnej ilości tekstu)
- Pokaż sugerowaną naprawę: Włącz/Wyłącz
- Pokaż linie: Włącz/Wyłącz
- Pokaż linię wejścia: Włącz/Wyłącz
- Kontrolki wyrównania panelu i ograniczenie aktualizacji dla wydajności
Wydajność i stabilność:
- Używa ostatniego zamknięcia do obliczeń. Brak zachowania przerysowywania.
- Ograniczenie aktualizacji w celu zmniejszenia zużycia CPU na zajętych przestrzeniach roboczych.
- Obrona przed błędami danych symbolu, ograniczeniami brokera i brakującymi polami konta.
Ważne uwagi:
- QX RiskShield to narzędzie wspomagające decyzje, a nie porada finansowa.
- Wyniki zależą od specyfikacji symbolu Twojego brokera (wartość pipsa, rozmiar lota, minimalny wolumen itp.).
- Automatyczny kapitał to najlepsza próba. Jeśli platforma ogranicza dostęp, RiskShield bezpiecznie przełącza się na ręczny kapitał.
Idealne dla:
- Traderów FX Majors i indeksów
- Zasad ryzyka w stylu firm prop
- Skalperów i day traderów, którzy chcą szybkiego dobierania rozmiaru z rygorystycznymi kontrolami bezpieczeństwa
- Traderów, którzy wolą SL oparty na cenie, ale nadal chcą automatycznego dobierania rozmiaru
Handluj z kontrolą. Dobieraj rozmiar z precyzją.
Podsumowanie
Opinie klientów
5 | 0 % | |
4 | 100 % | |
3 | 0 % | |
2 | 0 % | |
1 | 0 % |


![Logo „[Stellar Strategies] MARSI Signal Plotter”](https://cdn.ctrader.com/image/webp/7b2b8da6-8f8e-4646-8d4a-4710c516c01e_25567)


