
คำอธิบาย
SmartFibonacci — การดึงกลับและขยาย Fibonacci อัตโนมัติที่ปรับแต่งได้ พร้อมการรองรับกรอบเวลาที่สูงขึ้น ป้ายราคาสินค้า และการแจ้งเตือนความใกล้เคียง เพื่อการตัดสินใจซื้อขายที่รวดเร็วและมั่นใจยิ่งขึ้น
คำอธิบายสั้นสำหรับร้านค้า (1–2 บรรทัด)
SmartFibonacci ตรวจจับจุดสูง/ต่ำของสวิงโดยอัตโนมัติและวาดเส้นดึงกลับ Fibonacci ที่ชัดเจนพร้อมขยายเส้นเพิ่มเติมตามต้องการบนแผนภูมิของคุณ การตั้งค่าการย้อนกลับที่ปรับแต่งได้ การตรวจจับสวิงในกรอบเวลาที่สูงขึ้น ป้ายราคาหรือเปอร์เซ็นต์ และการแจ้งเตือนความใกล้เคียง ทำให้เหมาะสำหรับทั้งการสเกลปิ้งภายในวันและการตั้งค่าสวิง
คำอธิบายผลิตภัณฑ์เต็มรูปแบบ (พร้อมคัดลอกวางสำหรับ cTrader Store)
SmartFibonacci เป็นตัวบ่งชี้ cTrader ที่น้ำหนักเบาและเน้นประสิทธิภาพ ซึ่งทำให้งานวิเคราะห์ Fibonacci เป็นอัตโนมัติ เพื่อให้คุณใช้เวลาน้อยลงในการวาดระดับและมีเวลามากขึ้นในการซื้อขาย มันจะค้นหาจุดสวิงสูงและต่ำล่าสุดภายในช่วงเวลาย้อนกลับที่ตั้งค่าได้ วาดระดับการดึงกลับและระดับขยาย (โปรเจกชัน) ตามต้องการ และแสดงป้ายราคาและเปอร์เซ็นต์เพื่อการตีความที่รวดเร็ว สำหรับสัญญาณที่แข็งแกร่ง SmartFibonacci สามารถคำนวณจุดสวิงในกรอบเวลาที่สูงกว่าในขณะที่แสดงระดับบนแผนภูมิปัจจุบันของคุณ การแจ้งเตือนในตัว (ป๊อปอัพ + เสียง) จะแจ้งเตือนเมื่อราคามาใกล้ระดับ Fibonacci ที่มองเห็นได้ภายในระยะพิปที่ตั้งค่าได้
รายการนี้รวมถึง: ภาพหน้าจอที่ชัดเจนแสดงองค์ประกอบ UI สำคัญ กระบวนการทำงานตัวอย่าง การตั้งค่าการกำหนดค่า และผลลัพธ์ตัวอย่าง (ป้ายราคา ขยาย เสียงแจ้งเตือน) เพื่อให้ง่ายต่อการประเมินฟังก์ชันและประสบการณ์ผู้ใช้ก่อนการซื้อ
คุณสมบัติหลัก
- การตรวจจับสวิงอัตโนมัติ — ค้นหาจุดสวิงสูง/ต่ำล่าสุดภายในหน้าต่างย้อนกลับที่ตั้งค่าได้
- ตัวเลือกสวิงกรอบเวลาที่สูงกว่า — คำนวณจุดสวิงในกรอบเวลาที่สูงกว่าเพื่อระดับที่เรียบเนียนและมีความหมายมากขึ้น
- การดึงกลับและขยาย — วาดเส้นดึงกลับมาตรฐานและระดับขยาย (โปรเจกชัน) ตามต้องการ (เปอร์เซ็นต์ที่ผู้ใช้กำหนด เช่น 127.2, 161.8 เป็นต้น)
- ป้ายราคาและเปอร์เซ็นต์ — แต่ละระดับที่มองเห็นจะแสดงเปอร์เซ็นต์และราคาที่แน่นอนเพื่อการตัดสินใจที่รวดเร็ว
- การปรับแต่งภาพ — ตั้งค่าสี (ดึงกลับ / ขยาย), ความหนาเส้น และรูปแบบเส้น
- การแจ้งเตือนความใกล้เคียง — ป๊อปอัพ + เสียงเมื่อราคามาใกล้ระดับ Fibonacci ที่มองเห็นได้ภายในรัศมีพิปที่ตั้งค่าได้; ตัวเลือกแจ้งเตือนเฉพาะระดับที่ใกล้ที่สุดเท่านั้น
- ตรรกะการวาดซ้ำที่มีประสิทธิภาพ — ตัวบ่งชี้จะวาดซ้ำเฉพาะเมื่อจุดสวิงเปลี่ยนแปลงเพื่อลดความยุ่งเหยิงบนแผนภูมิและการใช้ CPU
- ค่าเริ่มต้นที่ปลอดภัย — ค่าเริ่มต้นที่เหมาะสมสำหรับผู้ซื้อขายที่ต้องการใช้งานทันทีหลังติดตั้ง
- เข้ากันได้กับ cTrader / cAlgo — ออกแบบมาให้ทำงานเป็นตัวบ่งชี้ซ้อนทับ
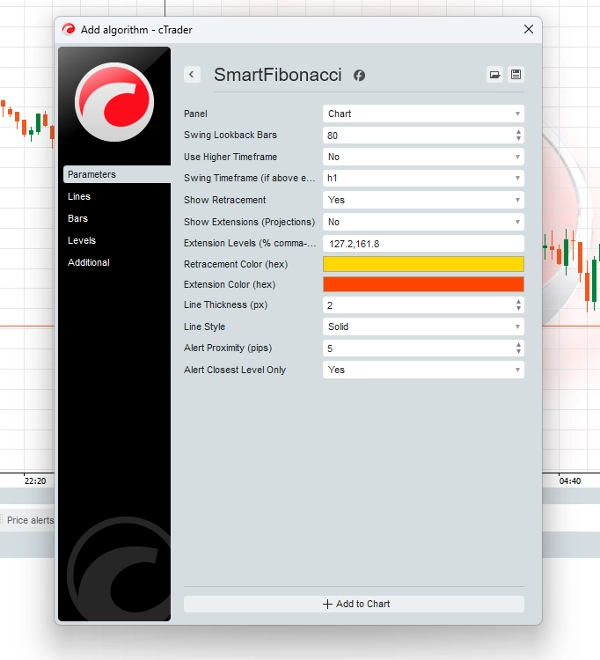
การตั้งค่า (พารามิเตอร์และคำอธิบาย)
- จำนวนแท่งย้อนกลับสวิง (int) — จำนวนแท่งที่ค้นหาย้อนกลับเพื่อหาจุดสวิงสูง/ต่ำ (ค่าเริ่มต้น 80)
- ใช้กรอบเวลาที่สูงกว่า (bool) — เปิดใช้งานการตรวจจับในกรอบเวลาที่สูงกว่าในขณะที่วาดบนแผนภูมิปัจจุบัน
- กรอบเวลาสวิง (TimeFrame) — กรอบเวลาที่สูงกว่าที่จะใช้เมื่อ
Use Higher Timeframeถูกเปิดใช้งาน - แสดงการดึงกลับ (bool) — สลับการวาดระดับการดึงกลับ
- แสดงการขยาย (bool) — สลับการวาดระดับขยาย/โปรเจกชัน
- ระดับขยาย (string) — ค่าร้อยละที่คั่นด้วยจุลภาค (เช่น
127.2,161.8) ใช้เติมเส้นโปรเจกชัน - สีการดึงกลับ / สีการขยาย (hex) — เลือกสีสำหรับเส้นดึงกลับและขยาย
- ความหนาเส้น (px) — การตั้งค่าความหนาเส้นเป็นจำนวนเต็ม
- รูปแบบเส้น (enum) — เลือกแบบเส้นทึบ, ขีด ฯลฯ
- ระยะการแจ้งเตือนความใกล้เคียง (พิป) — ระยะทางในพิปสำหรับการแจ้งเตือนความใกล้เคียง
- แจ้งเตือนเฉพาะระดับที่ใกล้ที่สุด (bool) — เมื่อเปิดใช้งาน จะมีการแจ้งเตือนป๊อปอัพเฉพาะระดับ fib ที่ใกล้ที่สุดเท่านั้น
ผลลัพธ์การวิเคราะห์และองค์ประกอบ UX
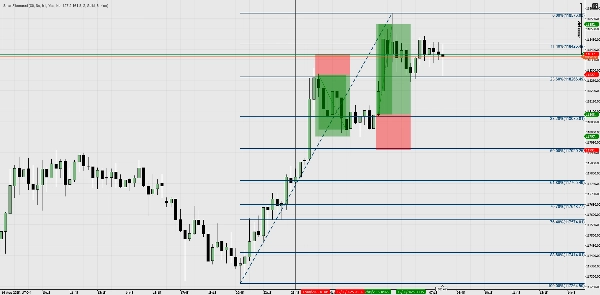
- เส้นบนแผนภูมิ — เส้นดึงกลับและขยายพร้อมป้ายเปอร์เซ็นต์ที่ชัดเจน (เช่น 61.8%) และป้ายราคาสินค้า (เช่น 1.23456)
- การแจ้งเตือนป๊อปอัพ — ผู้ใช้จะได้รับป๊อปอัพบนหน้าจอและเสียงระบบเมื่อราคามาในพื้นที่
Alert Proximity - การวาดซ้ำที่ไม่รบกวน — อัปเดตเฉพาะเมื่อการตรวจจับสวิงเปลี่ยนแปลงเพื่อหลีกเลี่ยงการกะพริบบ่อยครั้ง
- ความสอดคล้องของแหล่งที่มาของราคา — การแจ้งเตือนและป้ายถูกคำนวณโดยใช้ชุด Bars เดียวกับที่วาด fib (สำคัญเมื่อใช้การคำนวณกรอบเวลาที่สูงกว่า)
ตัวอย่างกระบวนการทำงาน / สถานการณ์การใช้งาน
- การตั้งค่าอย่างรวดเร็ว (สเกลปิ้ง / ภายในวัน)
-
- แนบ SmartFibonacci กับแผนภูมิ 5 นาที ตั้งค่า
Lookback = 80,ShowRetrace = true. - ดูระดับการดึงกลับและใช้ 61.8% / 50% เป็นโซนปฏิกิริยาภายในวัน
- เปิดใช้งาน
Alert Proximity = 5 pipsเพื่อรับการแจ้งเตือนเมื่อราคามาใกล้ระดับสำคัญ
- แนบ SmartFibonacci กับแผนภูมิ 5 นาที ตั้งค่า
- บริบทกรอบเวลาที่สูงกว่า (การเทรดสวิง)
-
- ตั้งค่า
Use Higher Timeframe = trueและเลือกHigher Timeframe = H4(หรือ Daily) - ระดับสะท้อนสวิง H4 ขณะที่คุณเทรดบน H1 หรือ M30 — การจัดแนวที่ดีกว่ากับโครงสร้างกรอบเวลาที่สูงกว่า
- ใช้การขยาย (127.2, 161.8) เป็นเป้าหมายกำไรสำหรับการเทรดสวิง
- ตั้งค่า
- การตรวจสอบ + การรวมกัน
-
- รวมระดับ SmartFibonacci กับแนวรับ/แนวต้าน โครงสร้างที่แตก หรือค่าเฉลี่ยเคลื่อนที่ที่มีอยู่เพื่อยืนยันการเข้า
- ใช้การแจ้งเตือนป๊อปอัพเพื่อจับเวลาการเข้า หรือบันทึกการโต้ตอบเพื่อทดสอบย้อนหลัง
- กระบวนการทำงานที่ขับเคลื่อนด้วยการแจ้งเตือน
-
- เปิดตัวบ่งชี้ไว้ขณะติดตามแผนภูมิจำนวนมาก รับป๊อปอัพเมื่อราคามาใกล้ระดับ fib ที่ตั้งค่าไว้และดำเนินการตามนั้น
สรุป
รีวิวจากลูกค้า
5 | 100 % | |
4 | 0 % | |
3 | 0 % | |
2 | 0 % | |
1 | 0 % |


