Description
🧠 Advanced RSI Indicator – Precision Momentum Analysis
Gain Deeper Insight into Market Trends with a Smarter RSI
The Advanced RSI Indicator is a powerful evolution of the classic RSI tool, developed for traders who value precision and smart signal filtering. With advanced algorithmic smoothing, adaptive zones, and integrated divergence detection, this tool provides refined momentum analysis for all markets and timeframes.
🔍 Key Features:
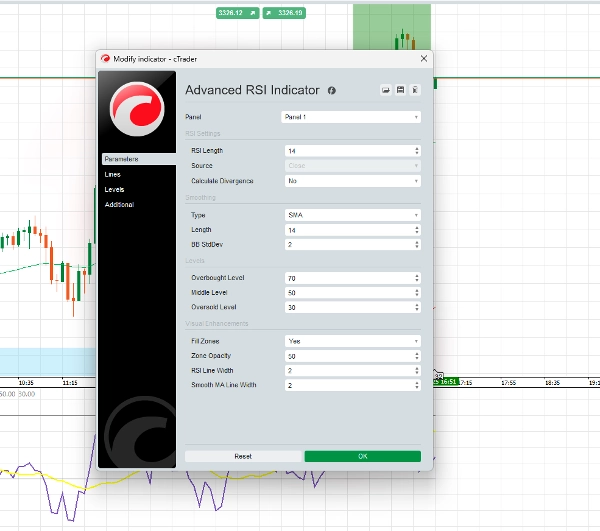
✅ Smoothed RSI Curve
Reduces choppy movement and false signals for clearer insights into market trends.
✅ Adaptive Signal Zones
Goes beyond the traditional 70/30 levels with dynamic thresholds that respond to market volatility.
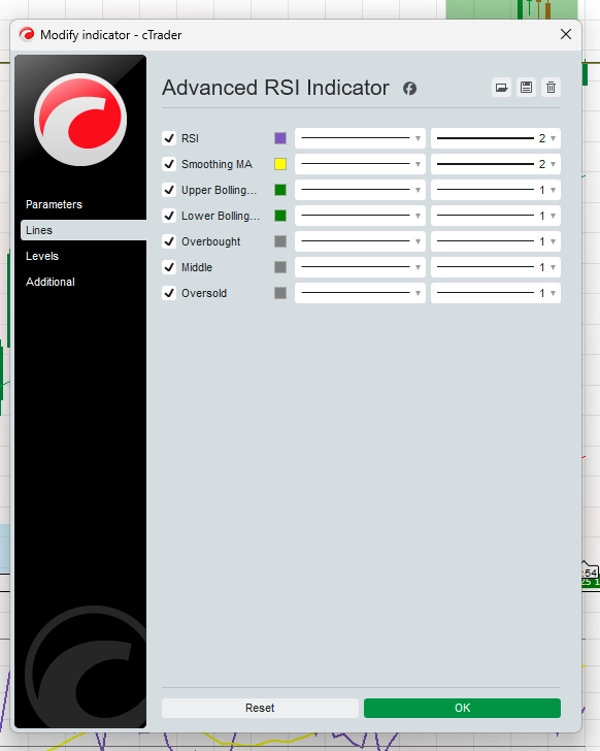
✅ Color-Coded Momentum Zones
Quickly assess bullish or bearish momentum with an intuitive visual design.
✅ Divergence Alerts
Highlights bullish and bearish divergence setups to support strategic decision-making.
✅ Custom Alert System
Set up alerts for RSI level crossings and divergence signals so you never miss key moments.
✅ Multi-Asset, Multi-Timeframe
Optimized for use across forex, crypto, stocks, indices, and more — from M1 to daily charts.
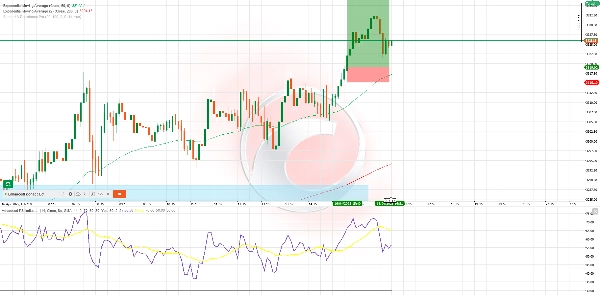
⚙️ Strategy Example – RSI Wave Ride
Best for: H1 & H4 swing trades
Indicators used: Advanced RSI, 50 EMA, 200 EMA
Buy Example:
- Price is above 50 & 200 EMA
- RSI dips below 40 and begins to rise
- Bullish momentum color appears
- (Optional) Bullish divergence detected
- Entry: Candle close above signal
- SL: Below last swing low
- TP: 1.5x–2x the risk or recent resistance
Sell Example:
- Price is below 50 & 200 EMA
- RSI moves above 60, then starts declining
- Bearish momentum color confirms direction
- (Optional) Bearish divergence adds strength
- Entry: Confirmation candle close
- SL: Above last swing high
- TP: 1.5x–2x the risk or recent support
💬 Why Traders Choose This Tool:
- User-friendly, yet powerful
- Non-repainting signals
- Tested across major markets
- Can be used standalone or alongside other strategies
Summary
Customer reviews
5 | 100 % | |
4 | 0 % | |
3 | 0 % | |
2 | 0 % | |
1 | 0 % |