Description
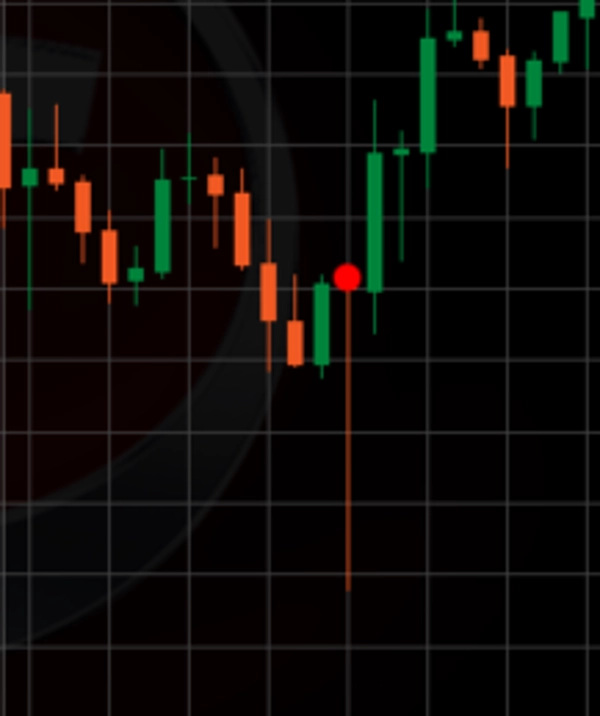
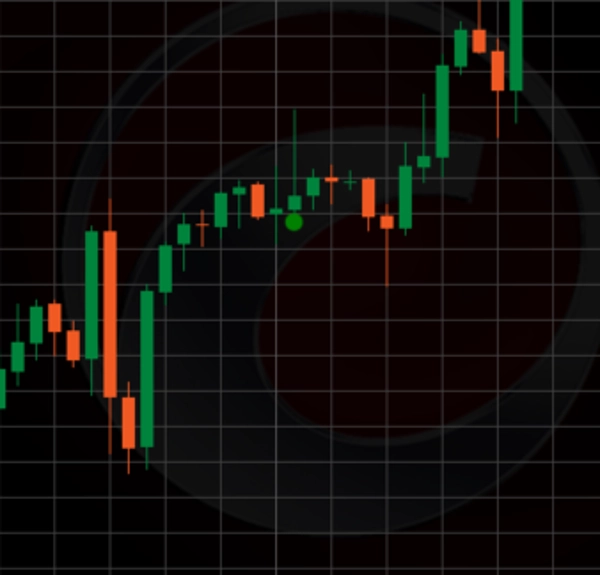
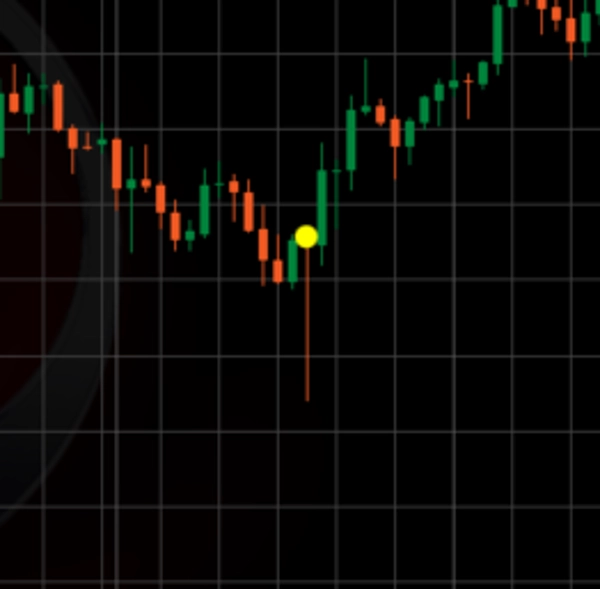
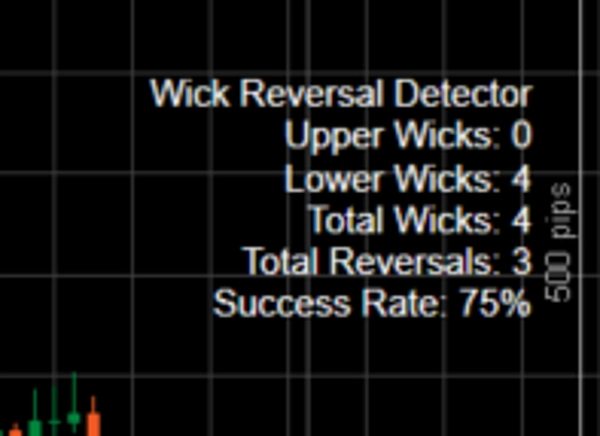
The Long Wick indicator is a powerful technical analysis tool built for cTrader that focuses on identifying candles with unusually long wicks—either upper or lower—relative to their body size and the average candle range. It highlights these wicks on the chart as potential reversal points, where the market may have rejected higher prices (for upper wicks, suggesting a bearish reversal) or lower prices (for lower wicks, suggesting a bullish reversal). The indicator uses a combination of a wick threshold multiplier, a minimum wick-to-body ratio, and a trend-filtering Simple Moving Average (SMA) to filter out noise and focus on significant price rejection patterns. Each detected wick is marked with a circle (green for upper wicks, red for lower wicks if confirmed as reversals, or yellow if not), and statistical data (e.g., total wicks, reversals, and success rate) is displayed on the chart for easy tracking.
How to Use in Trading:
- Identifying Reversal Opportunities: Use the indicator to spot long wicks that occur at key support or resistance levels, or against the prevailing trend (e.g., a long lower wick in a downtrend for a potential bullish reversal). A solid green or red circle indicates a confirmed reversal based on price action within the lookforward period, making it a signal to consider entering a trade in the opposite direction (e.g., buy on a red lower wick reversal, sell on a green upper wick reversal).
- Confirmation with Other Tools: Combine the Long Wick indicator with other technical indicators (e.g., RSI, MACD, or support/resistance lines) to confirm reversal signals and avoid false positives, especially in choppy markets.
- Risk Management: Place stop-loss orders beyond the wick’s extreme (e.g., below the low for a bullish reversal) to protect against the possibility that the reversal fails, and set take-profit levels based on nearby support/resistance or a risk-reward ratio (e.g., 1:2).
- Monitoring Success Rate: Regularly check the displayed success rate to assess the indicator’s effectiveness over time and adjust your strategy accordingly.
Adjusting Parameters for Best Usage:
- Lookback Period (Default: 5): Determines the number of bars used to calculate the average candle range. A shorter period (e.g., 3-10) makes the indicator more sensitive to recent volatility, ideal for fast-moving markets, while a longer period (e.g., 20-50) smooths the average for trendier conditions. Adjust based on your timeframe (e.g., lower for 1-minute charts, higher for 1-hour charts).
- Lookforward Period (Default: 15): Sets the number of bars to confirm a reversal. A shorter period (e.g., 5-10) suits quick scalping strategies, while a longer period (e.g., 15-30) is better for swing trading to capture extended reversals. Increase if you notice too many yellow markings where reversals occur later.
- Wick Threshold Multiplier (Default: 1.3): Multiplies the average candle range to set the minimum wick length. Lower values (e.g., 1.0-1.5) detect more wicks (useful in low-volatility markets), while higher values (e.g., 2.0-3.0) filter for only the most significant wicks (better in high-volatility markets). Tune this to balance sensitivity and signal quality.
- Trend Period (SMA) (Default: 21): Defines the SMA length for trend filtering. A shorter period (e.g., 10-20) responds to short-term trends, while a longer period (e.g., 50-100) aligns with longer-term trends. Adjust to match your trading horizon and market conditions.
- Min Wick to Body Ratio (Default: 3): Sets the minimum ratio of wick length to body size. A lower ratio (e.g., 2-3) includes more candles with moderate wicks, while a higher ratio (e.g., 4-5) focuses on candles with very pronounced wicks. Increase for stricter reversal signals, decrease for more opportunities.
- Reversal Tolerance (Pips) (Default: 5): Allows a tolerance in pips for the price to extend beyond the wick’s extreme before disqualifying a reversal. A smaller value (e.g., 2-3) ensures strict reversal confirmation, while a larger value (e.g., 5-10) accommodates minor retracements. Adjust based on the symbol’s pip value and volatility.
Optimization Tips:
- Start with the default settings and backtest on historical data for your preferred instrument and timeframe.
- In trending markets, increase the Wick Threshold Multiplier and Min Wick to Body Ratio to focus on stronger reversal signals.
- In ranging markets, lower these parameters to capture more wicks, but pair with a shorter Lookforward Period to avoid late disqualifications.
- Regularly review the success rate and adjust parameters if it drops below your acceptable threshold (e.g., 70%).
By customizing these parameters, traders can tailor the Long Wick indicator to their specific strategy, enhancing its effectiveness in spotting high-probability reversal points in various market conditions.
Summary
Traders can use the indicator to spot reversal opportunities at key support or resistance levels or against prevailing trends. It is recommended to confirm signals with other technical tools such as RSI or MACD and to apply risk management by placing stop-loss orders beyond wick extremes. The indicator’s parameters—including lookback and lookforward periods, wick threshold multiplier, SMA trend period, minimum wick-to-body ratio, and reversal tolerance—are adjustable to suit different market conditions and trading styles. Regular review of the success rate helps optimize performance.
Customer reviews
5 | 0 % | |
4 | 100 % | |
3 | 0 % | |
2 | 0 % | |
1 | 0 % |