Description
KNN Machine Learning Momentum Stop lagging. Start predicting. Institutional-grade K-Nearest Neighbors analytics.
Default parameters optimized for XAUUSD. Works on any timeframe — choose based on your trading style. Higher timeframes deliver cleaner, higher-probability signals. Lower timeframes generate more signals with slightly more noise. See the Timeframe Guide below.
🥈 Also Available: XAGUSD Automated Bot Version Love the logic? Take it further. A dedicated bot version of this indicator — fine-tuned specifically for XAGUSD (Silver) — is available on the marketplace. It runs fully automated, executing trades on your behalf with no manual input required. Priced low relative to the ROI it's built to deliver.
👉 KNN XAGUSD Bot — View on cTrader Market
⏱ Timeframe Guide
TimeframeSignal VolumeNotes
M5
Very High
More noise — requires stricter discipline and filtering to avoid overtrading.
M8
High (DEFAULT)
The optimized baseline. Best balance between signal frequency and accuracy for XAUUSD.
M15
Medium
Cleaner, higher-quality signals with fewer entries per session.
M30 / H1
Low
Highest accuracy — best suited for swing-style setups with more patience required.
Default parameters were backtested on M8. If you switch timeframes, consider adjusting ATR Period and SL/TP multipliers accordingly.
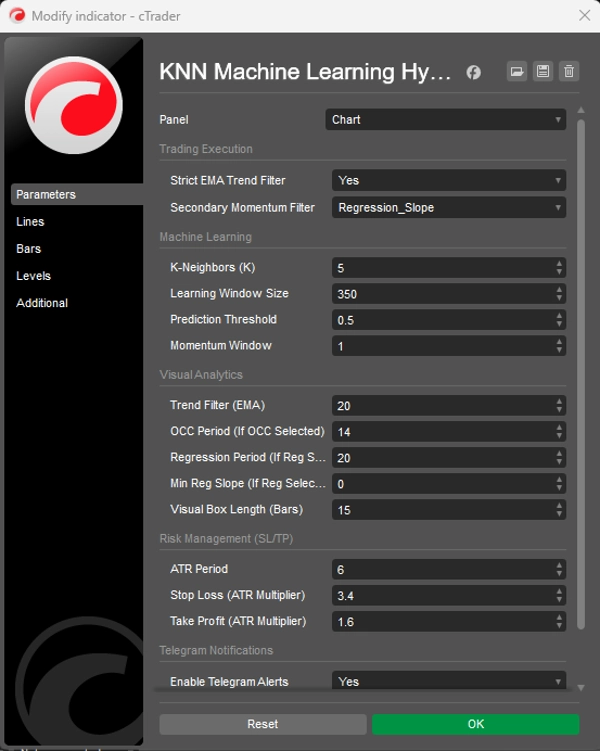
⚙️ Default Parameters
Learning Window (350) — Number of historical candles the KNN engine scans for pattern matches.
Prediction Threshold (0.5) — Minimum confidence score required before a signal is generated.
ATR Period (6) — Period used to calculate Average True Range for SL/TP sizing.
Stop Loss Multiplier (3.4) — SL distance = ATR × 3.4. Wider to give Gold's volatility room to breathe.
Take Profit Multiplier (1.6) — TP distance = ATR × 1.6. Tighter to lock in profits quickly and maintain a high win rate.
Trend Filter EMA (20) — Period of the EMA used as the trend filter — the Blue Line on your chart.
🤖 Predictive KNN Engine Compresses RSI and MA deviation into a historical matching algorithm. On every candle, it scans the last 350 bars and finds the 5 most similar past moments to forecast direction.
📈 Strict EMA Trend Filter Suppresses low-probability counter-trend setups automatically. Only signals aligning with the broader trend are marked high-probability.
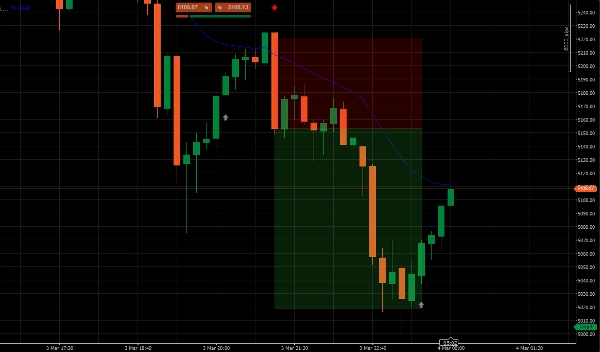
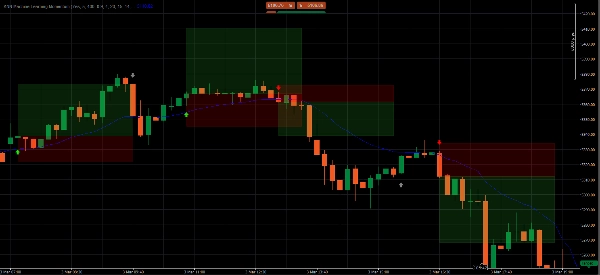
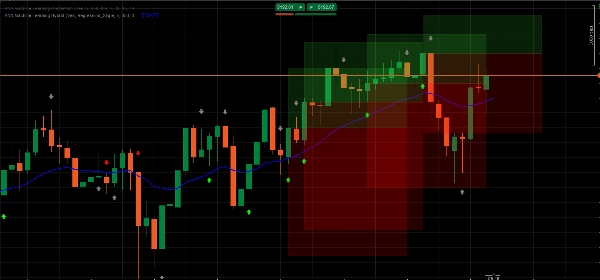
📦 Dynamic ATR Target Zones Projects transparent colored boxes for your Take Profit and Stop Loss zones, adapting in real-time to current market volatility via ATR.
🧹 UI Memory Manager Keeps your chart clean by automatically removing old zones. Only the 5 most recent setups are displayed at any time.
📲 Telegram Push Alerts Built-in webhook integration sends instant trade alerts with exact Entry, TP, and SL prices directly to your phone.
📊 Reading the Signals
🟢 Bright Green Arrow — High-Probability BUY KNN predicts price will rise AND price is above the EMA. Full trend alignment. These are the premium setups to trade.
🔴 Bright Red Arrow — High-Probability SELL KNN predicts price will fall AND price is below the EMA. Full trend alignment. Enter at the close of the signal candle.
⚪ Gray Arrow — Counter-Trend (DO NOT TRADE) Momentum shift detected, but against the broader trend. Printed for awareness only — significantly lower probability.
▶️ Execution Guide
- Wait for a Bright Green or Bright Red Arrow — ignore gray signals entirely.
- Wait for the signal candle to fully close before entering.
- Set SL and TP at the outer horizontal edge of each box — the edge furthest from your entry price.
❓ FAQ
Why does an arrow appear? Every candle, the algorithm snapshots current RSI and MA momentum, scans the last 350 bars for the 5 most mathematically similar moments, and forecasts direction based on where price went from those moments.
What makes an arrow Bright vs. Gray? Bright arrows = AI signal and EMA trend in full agreement — highest probability. Gray arrows = momentum detected but counter-trend — flagged as too risky to trade.
Which timeframe should I use? M8 is the optimized default. Higher timeframes (M15, M30, H1) give fewer but cleaner signals. M5 gives more signals but demands sharper filtering discipline.
Where exactly do I place SL and TP? At the outer horizontal edge of each colored box — the edge furthest from your entry price.
Can I use this on assets other than Gold? Yes — applicable to any asset on cTrader. However, parameters were backtested specifically for XAUUSD. Other instruments will benefit from a parameter tuning period.
⚠️ Risk Disclaimer Trading foreign exchange, commodities, and CFDs on margin carries a high level of risk and may not be suitable for all investors. This indicator is a quantitative analysis tool for educational and informational purposes only — it does not constitute financial advice. Past performance is not indicative of future results. Always test on a demo account before risking live capital.
Summary
Key functionalities include dynamic Average True Range (ATR)-based stop loss and take profit target zones that adapt to market volatility, and a UI memory manager that keeps charts clear by displaying only the five most recent setups. Signals are visually represented by arrows: bright green for high-probability buy, bright red for high-probability sell, and gray for counter-trend momentum (not recommended for trading). The indicator supports multiple timeframes, with M8 as the default optimized setting balancing signal frequency and accuracy.
Additionally, it integrates Telegram push alerts via webhook, delivering real-time trade signals with precise entry, stop loss, and take profit levels. Users are advised to wait for signal candle closure before entering trades and to place stops and targets at the edges of the ATR target zones. Parameters such as learning window, prediction threshold, ATR period, and multipliers for stop loss and take profit are configurable to suit different trading styles.