Description
The Problem: Information Overload
Most traders fail because their charts are cluttered with lagging indicators and too many lines. They lose sight of the most important thing: Market Structure.
The Solution: Trend Bias Structure
This indicator is a "Two-in-One" powerhouse for the cTrader platform. It combines professional-grade Swing Detection with an objective Scoring Engine that tells you exactly who is in control of the market.
Key Features:
- Smart Structure Mapping: Automatically identifies significant Support and Resistance levels using ATR-filtered volatility.
- The SGE Scoring Engine: A unique grading system (-2, 0, +2) that calculates trend strength based on how many structural levels have been breached.
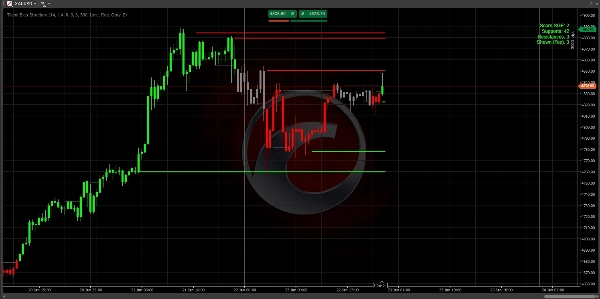
- Anti-Clutter Technology: Only displays the 3 closest relevant levels to the current price. Your chart stays clean, professional, and actionable.
- Momentum Detection: Uses "Big Candle" logic to ensure you only trade moves with real institutional backing.
- Fully Customizable: Tailor the sensitivity to your specific asset (XAUUSD, Forex, or Indices).
How to Trade with it:
- Check the Score: Look for +2 (Bullish) or -2 (Bearish).
- Wait for the Pullback: Let the price return to one of the drawn Structure Lines.
- Execute: Trade with the bias, using the levels as your entry/exit anchors.
Technical Specifications
- Platform: cTrader
- Language: C# (.NET)
- Timeframes: Works on all timeframes (M1 to Monthly).
- Assets: Optimized for high-liquidity pairs (XAUUSD, EURUSD, GBPUSD).
Note: Initial Settings: For most major pairs, the default settings are optimized. If you are trading volatile indices, you may want to increase the Range Global ATR Mult to 2.0
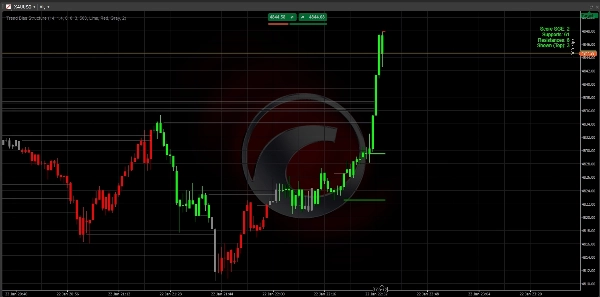
Important: Reading the Dashboard
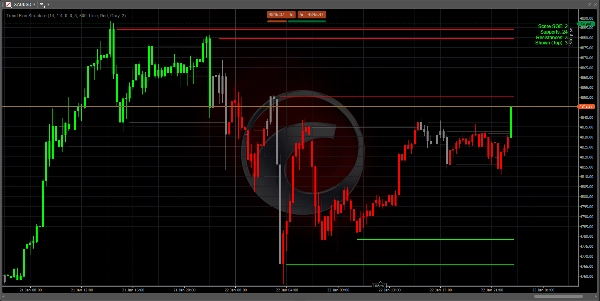
The dashboard in the top-right corner is your command center:
- Score +2 (Green): Strong Bullish. Only look for Buy setups.
- Score -2 (Red): Strong Bearish. Only look for Sell setups.
- Score 0 (Gray): Neutral. The market is ranging or in transition. Stay patient.
- Supports/Resistances: Shows how many historical "floors" and "ceilings" exist in the current trend.
3-Step Entry Strategy
Step 1: Identify the Bias Wait for the candle colors and the Dashboard score to hit +2 or -2. This confirms that the market has broken structure and a trend is starting.
Step 2: The Value Area Don't chase the price. Wait for the price to pull back (retracement) toward one of the nearest 3 lines drawn on your chart.
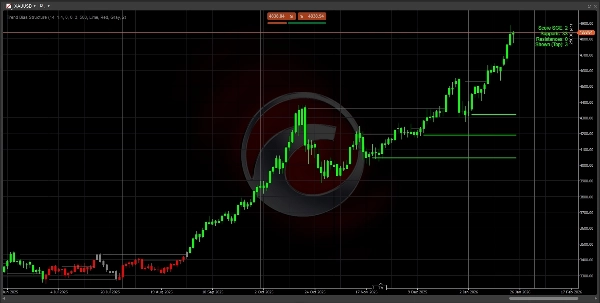
- In a downtrend (Score -2), wait for price to touch a Red Line.
- In an uptrend (Score +2), wait for price to touch a Green Line.
Step 3: Execution Enter your trade when price touches the line and shows a rejection (a wick forming).
- Stop Loss: Place your SL just behind the structural line.
- Take Profit: Target the next structural line in the direction of the trend.
Pro Tips for Success
- Higher Timeframes Rule: A Score of +2 on the H4 or D1 chart is much more powerful than a score on the M5 chart. Use the higher timeframe to find the bias, and the lower timeframe to find your entry.
- Clean Charts: If the screen feels busy, go to settings and change
Max Levels to Showto 2. This will show you only the most critical "Floor" and "Ceiling." - The "Zero" Zone: When the score is 0, the market is "re-calculating." This is the best time to take profits from previous trades and wait for a new breakout.
Troubleshooting
- No Lines Visible? Check if you have enough history loaded on your chart. The indicator needs at least 100-200 bars to calculate the ATR and Swing levels.
- Indicator Lag? If your PC is slow, reduce the
Max Historical Linessetting to 200 to clear memory faster.
Frequently Asked Questions (FAQ)
Q: Does this indicator repaint?
A: No. The levels and scores are calculated based on confirmed candle closes. Once a level is broken or a score changes at the close of a candle, it is locked into the history.
Q: Which timeframe is best?
A: The logic is universal. However, most professional traders use it on H1, H4, or Daily charts to identify "Institutional Structure." If you scalp on M1 or M5, expect more frequent score changes.
Q: Can I use this with other indicators?
A: Yes! It works perfectly as a "Directional Filter." For example, only take RSI oversold signals if the Trend Bias Score is +2.
Happy Trading!
No Financial Advice. The Trend Bias Structure indicator is a technical analysis tool designed to assist traders in identifying market structure and trend bias.
Summary
Key features include:
- Smart Structure Mapping: Automatically detects significant support and resistance levels filtered by ATR-based volatility.
- SGE Scoring Engine: Calculates trend strength by counting breached structural levels.
- Anti-Clutter Display: Shows only the three closest relevant levels to maintain chart clarity.
- Momentum Detection: Uses "Big Candle" logic to highlight moves with institutional backing.
- Customizable sensitivity for different assets such as XAUUSD, EURUSD, GBPUSD, and indices.
The indicator works on all timeframes from 1 minute to monthly, with professional traders typically using H1, H4, or daily charts to identify institutional structure. The dashboard provides a clear bias score and structural levels to guide trade entries and exits. Users are advised to trade with the bias, waiting for price pullbacks to the nearest structure lines before executing trades.
This tool is intended as a directional filter and can be combined with other indicators like RSI. It does not repaint, as calculations are based on confirmed candle closes.
Customer reviews
5 | 100 % | |
4 | 0 % | |
3 | 0 % | |
2 | 0 % | |
1 | 0 % |