
Description
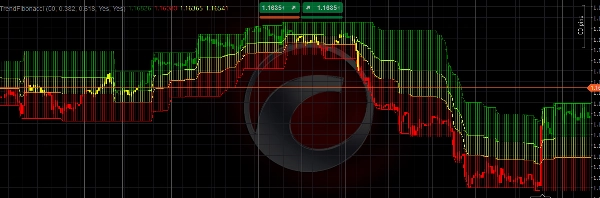
The TrendFibonacci indicator is designed to help traders identify critical price levels and market trends with precision. By integrating Fibonacci retracement levels with a Weighted Moving Average (WMA) and Average True Range (ATR), this indicator provides a clear, visual representation of support, resistance, and trend direction.
Key Features:
- Dynamic Fibonacci Levels: Automatically calculates and plots Fibonacci retracement levels (default: 0.382 and 0.618) based on the highest high and lowest low over a user-defined lookback period.
- Weighted Moving Average (WMA): Uses a 6-period WMA to gauge trend direction, with color-coded candles (Green for bullish, Red for bearish, Yellow for neutral) to reflect the WMA’s position relative to Fibonacci levels.
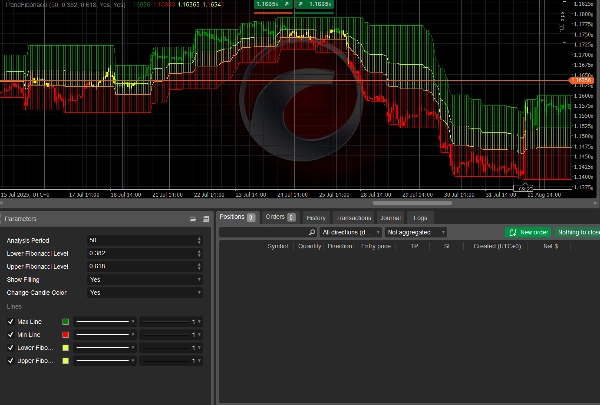
- Customizable Parameters: Adjust the analysis period, Fibonacci levels, and toggle features like filled zones and candle color changes.
- Visual Clarity: Plots high/low lines and fills areas between Fibonacci levels with semi-transparent colors for easy trend identification.
- ATR Integration: Incorporates a 200-period ATR for robust market analysis, ensuring adaptability to volatility.
This indicator is ideal for traders seeking to combine Fibonacci analysis with trend-following strategies. Whether you're trading forex, stocks, or commodities, TrendFibonacci enhances your ability to spot key reversal zones and make informed trading decisions.
How to Use
- Install the Indicator:
- Add the TrendFibonacci indicator to your cTrader platform by uploading the source code or downloading it from the marketplace.
- Configure Parameters:
- Analysis Period: Set the lookback period (default: 50 bars) to determine the range for calculating high/low prices.
- Lower Fibonacci Level: Adjust the lower Fibonacci retracement level (default: 0.382).
- Upper Fibonacci Level: Adjust the upper Fibonacci retracement level (default: 0.618).
- Show Filling: Enable/disable filled zones between Fibonacci levels (default: enabled).
- Change Candle Color: Enable/disable color-coded candles based on WMA position (default: enabled).
- Interpret the Indicator:
- Green Candles: Indicate a bullish trend when the WMA is above the upper Fibonacci level.
- Red Candles: Signal a bearish trend when the WMA is below the lower Fibonacci level.
- Yellow Candles: Suggest a neutral zone when the WMA is between the Fibonacci levels.
- Filled Zones: Visualize key price zones between the high/low lines and Fibonacci levels for support/resistance analysis.
- Trading Application:
- Use the indicator to identify potential entry/exit points at Fibonacci levels.
- Combine with other technical tools (e.g., RSI, MACD) for confirmation.
- Monitor color-coded candles to assess trend strength and direction.
- Best Practices:
- Test the indicator on a demo account to familiarize yourself with its behavior.
- Adjust parameters to suit your trading style and market conditions.
- Use on higher timeframes (e.g., H1, H4) for more reliable signals.
The TrendFibonacci indicator is a versatile tool for traders of all levels, offering clear, actionable insights into market trends and price levels.
Summary
Users can customize parameters such as the analysis period, Fibonacci levels, and visual features like filled zones between Fibonacci levels and candle color changes. The indicator visually highlights support and resistance zones by plotting high/low lines and filling areas between Fibonacci levels with semi-transparent colors. It is applicable across various markets including forex, stocks, commodities, and popular symbols like BTCUSD, EURUSD, GBPUSD, and XAUUSD.
TrendFibonacci supports traders in spotting potential entry and exit points at Fibonacci levels and can be combined with other technical tools like RSI and MACD for confirmation. It is recommended for use on higher timeframes (e.g., H1, H4) to enhance signal reliability.


!["[Hamster-Coder] Pivot Points MTF" logo](https://cdn.ctrader.com/image/webp/4c143e5a-309c-40e3-a578-f04d1e133ffa_31159)


