คำอธิบาย
แนะนำตัวชี้วัด Moving Average ที่ได้รับการปรับปรุง เพื่อการปรับแต่งและความยืดหยุ่นที่ดียิ่งขึ้นในการวิเคราะห์การซื้อขายของคุณ
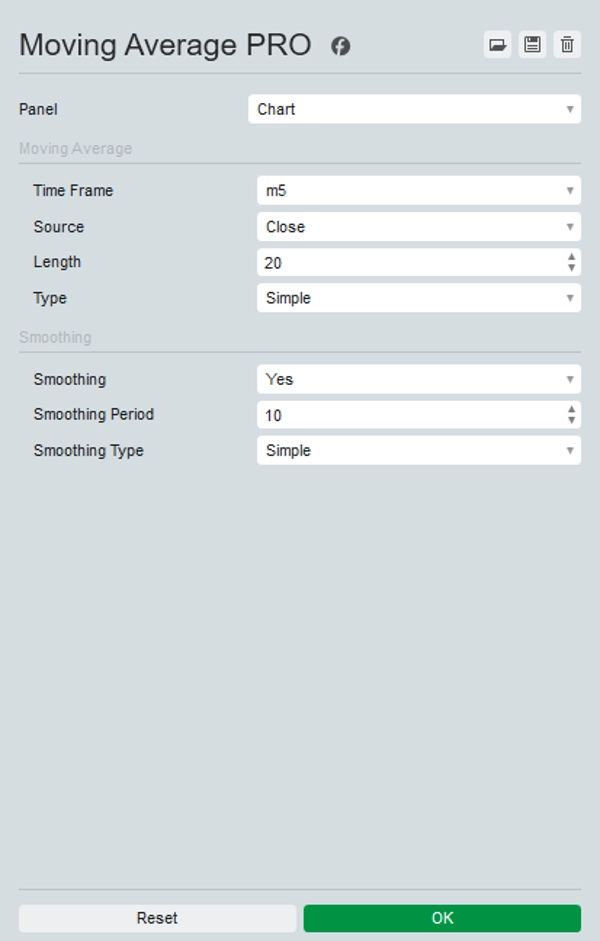
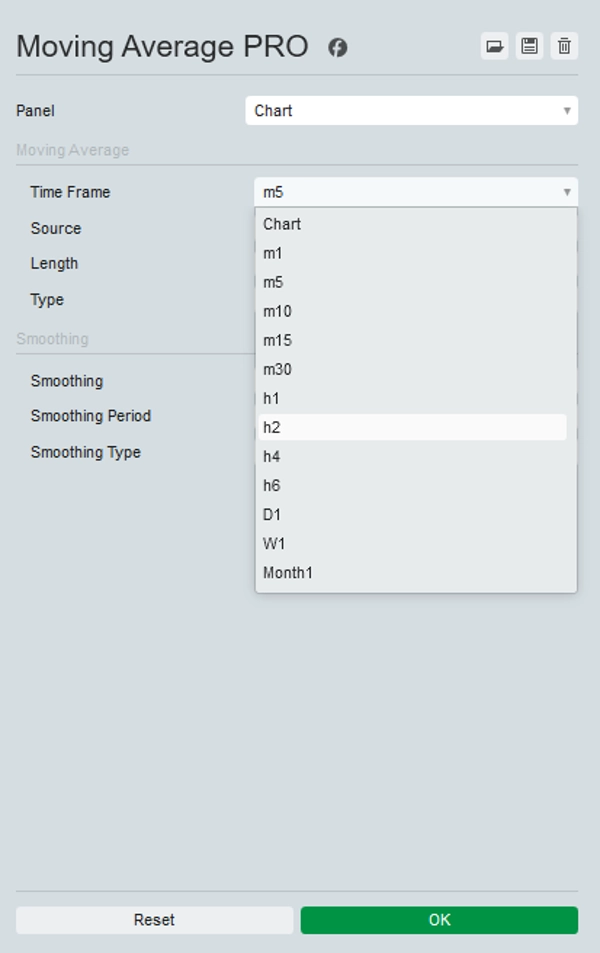
เวอร์ชันที่ปรับปรุงนี้ยังรองรับค่าเฉลี่ยเคลื่อนที่ของกรอบเวลาที่สูงขึ้นไปยังกรอบเวลาทีคและ Heikin Ashi Renko และช่วงเวลาของ Range ยังไม่รองรับในขณะนี้
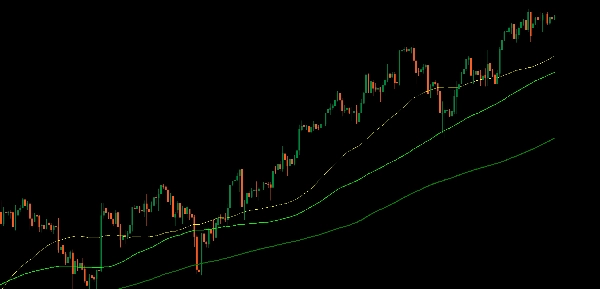
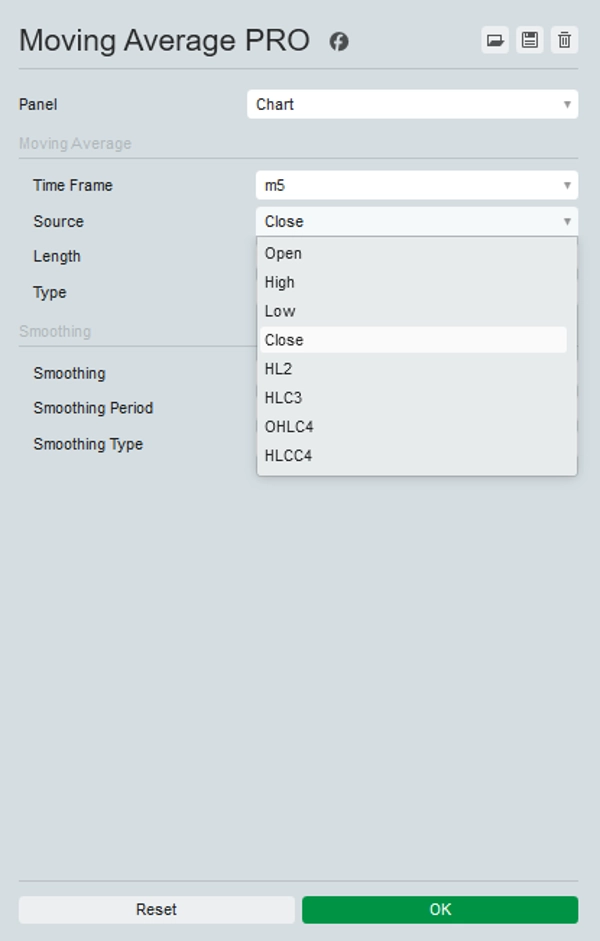
ตัวชี้วัดนี้ช่วยให้คุณเลือกกรอบเวลาใดก็ได้ ทำให้คุณสามารถแสดง MA 200 รายวันบนกรอบเวลาอื่น ๆ ได้
นอกจากนี้ยังมีแหล่งราคาหลากหลายให้เลือก รวมถึง Open, High, Low, Close, HL2, HLC3, OHLC4, และ HLCC4 เหมือนกับใน TradingView และตัวเลือกการปรับความเรียบเพื่อแก้ไขปัญหาการสุ่มตัวอย่างในกรอบเวลาที่ต่ำกว่า
ด้วยการให้ตัวเลือกเหล่านี้ คุณสามารถปรับแต่ง Moving Average ให้เหมาะกับกลยุทธ์การซื้อขายเฉพาะของคุณและได้รับข้อมูลเชิงลึกที่แม่นยำยิ่งขึ้นเกี่ยวกับแนวโน้มตลาด
อัปเกรดชุดเครื่องมือการซื้อขายของคุณด้วยตัวชี้วัด Moving Average ที่ได้รับการปรับปรุงเพื่อการวิเคราะห์และการตัดสินใจที่เหนือชั้น
สรุป
รีวิวจากลูกค้า
5 | 100 % | |
4 | 0 % | |
3 | 0 % | |
2 | 0 % | |
1 | 0 % |