
Chandelier Exit
อินดิเคเตอร์
5 การซื้อ
เวอร์ชัน 1.0, Oct 2025
Windows, Mac
4.3
รีวิว: 3
คำอธิบาย
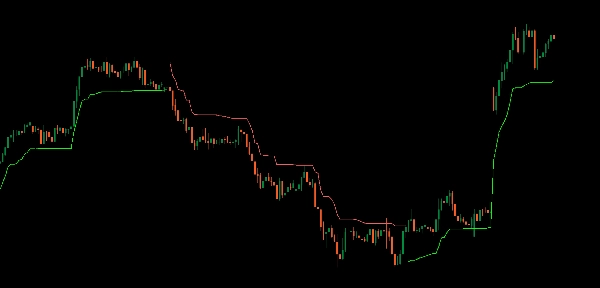
ขอแนะนำ Chandelier Exit ตัวชี้วัดสุดยอดสำหรับการเพิ่มประสิทธิภาพการออกจากการเทรดด้วยความแม่นยำและมั่นใจ
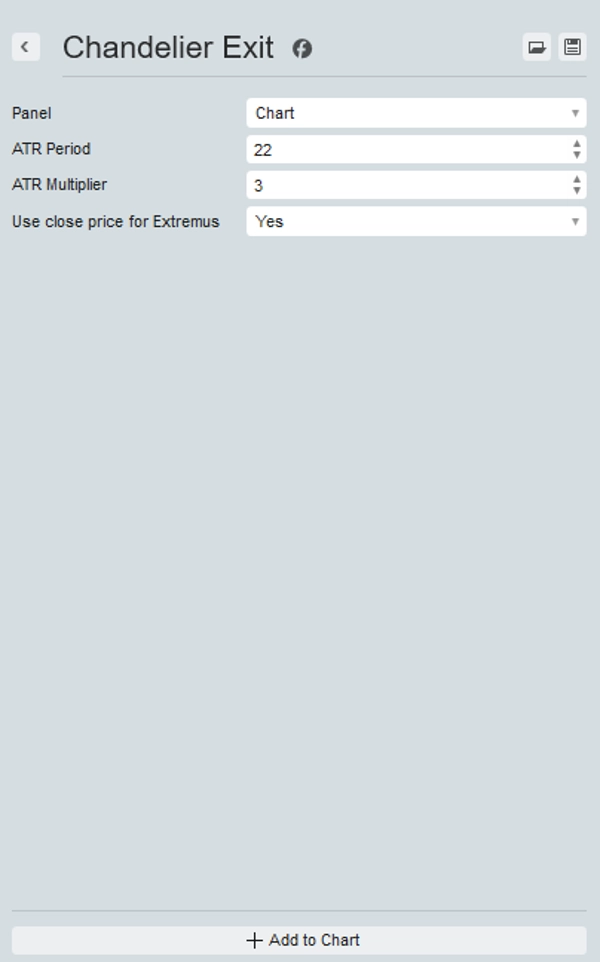
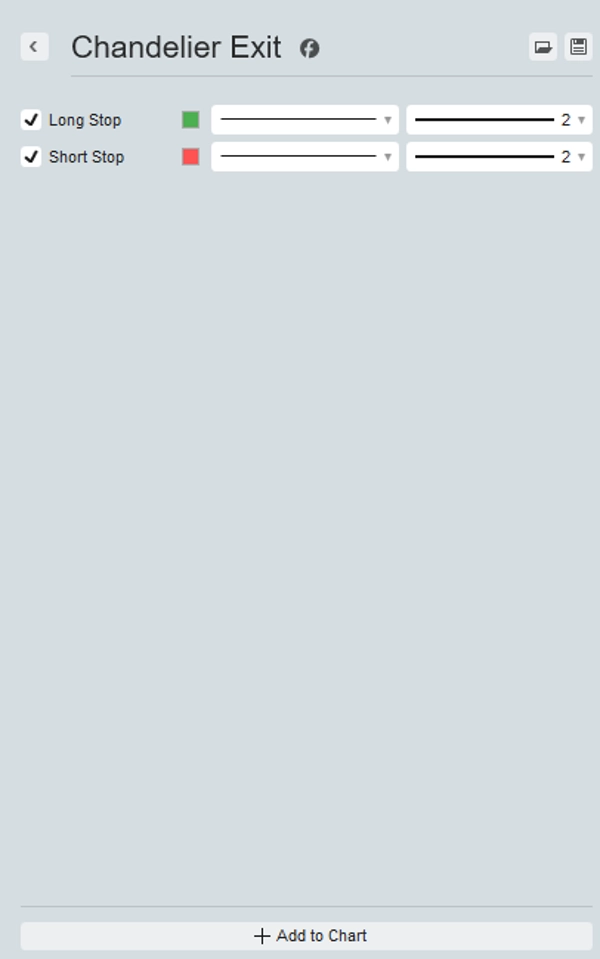
ตัวชี้วัดนี้คำนวณจุดหยุดขาดทุนอย่างไดนามิกโดยอิงจากราคาสูงสุดและ ATR ให้สัญญาณภาพที่ชัดเจนบนกราฟของคุณแบบเรียลไทม์
ออกแบบมาเพื่อช่วยให้คุณล็อกกำไรและปกป้องจากการกลับตัวของตลาด Chandelier Exit ช่วยให้คุณนำหน้าตลาดอยู่เสมอ
เหมาะสำหรับเทรดเดอร์ที่ต้องการพัฒนากลยุทธ์ด้วยสัญญาณออกที่เชื่อถือได้ ตัวชี้วัดนี้นำเสนอวิธีการจัดการความเสี่ยงที่ตรงไปตรงมาและเป็นภาพ อัปเกรดชุดเครื่องมือการเทรดของคุณและรักษากำไรของคุณด้วย Chandelier Exit.
สรุป
สรุปโดย AI
The Chandelier Exit indicator dynamically calculates stop-loss levels based on the highest high price and the Average True Range (ATR). It provides real-time visual cues on trading charts to help traders optimize exit points, lock in profits, and protect against market reversals. Suitable for various markets including Forex, cryptocurrencies, stocks, commodities, and indices, it supports symbols such as BTCUSD, EURUSD, GBPUSD, XAUUSD, NAS100, and USDJPY. The indicator offers a straightforward, visual method for managing risk and enhancing trading strategies by signaling reliable exit points.
โปรไฟล์อินดิเคเตอร์
รีวิวจากลูกค้า
4.3
รีวิว: 3
5 | 33 % | |
4 | 67 % | |
3 | 0 % | |
2 | 0 % | |
1 | 0 % |
รีวิวจากลูกค้า
October 9, 2025
Decent tool for testing if the trader wants it keeps trade control closer to the plan. It works best as support, not a final decision maker. The best use is 1 percent risk per trade, BE after 1R and partials near 1.5R. incorrect settings can give a false sense of safety.
October 8, 2025
October 8, 2025
Useful extra check for traders who care about risk before entries. It gives value around risk management, but incorrect settings can give a false sense of safety. I would check 30 trades and compare DD before and after the tool, aiming for less than 3 percent monthly DD. It is useful when the trader already respects stops and sizing.
การสนทนา
คำถามที่พบบ่อย
BTCUSD
Forex
Signal
Indices
EURUSD
Commodities
GBPUSD
NZDUSD
Prop
Scalping
Crypto
Stocks
XAUUSD
NAS100
ATR
USDJPY
ผลิตภัณฑ์ที่มีให้บริการผ่าน cTrader Store รวมถึงบอทการเทรด อินดิเคเตอร์ และปลั๊กอิน มีให้บริการโดยนักพัฒนาบุคคลที่สามและมีไว้เพื่อวัตถุประสงค์ในการเข้าถึงข้อมูลและทางเทคนิคเท่านั้น cTrader Store ไม่ใช่โบรกเกอร์และไม่ได้ให้คำแนะนำการลงทุน คำแนะนำส่วนบุคคล หรือการรับประกันผลการดำเนินงานในอนาคต


ราคา
ตั้งแต่ 25/09/2025
25
การขาย
316
ติดตั้งฟรี