
DailyMA
지표
1 구매
버전 1.0, Nov 2025
Windows, Mac
5.0
리뷰: 1
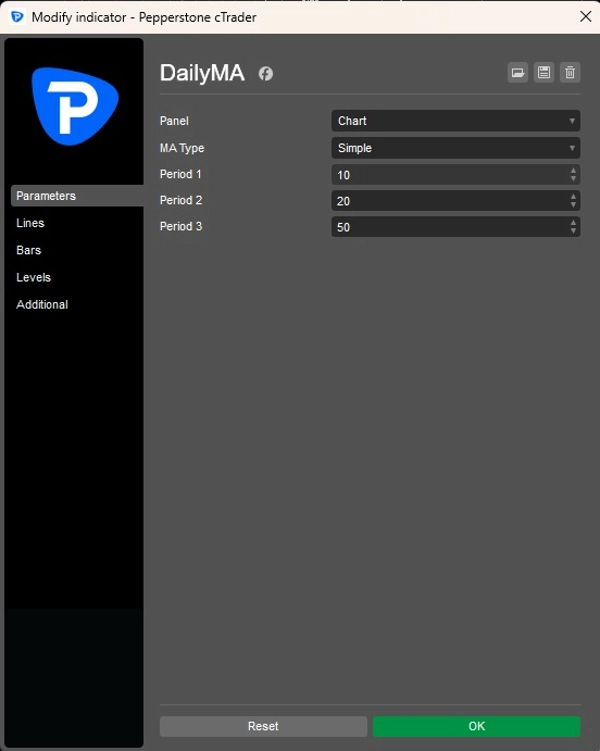
설명
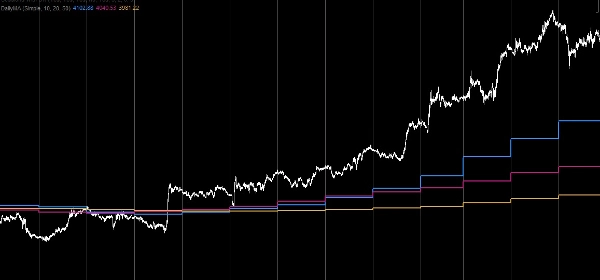
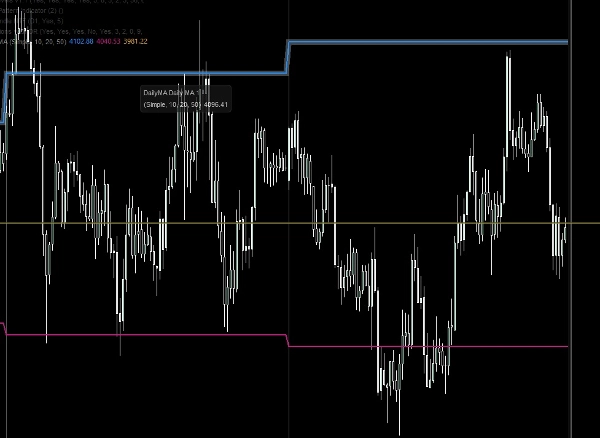
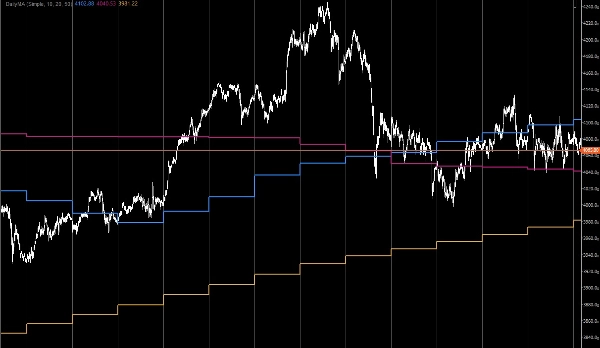
이 일간 이동 평균 지표는 일중 차트에 상위 타임프레임 구조를 오버레이하려는 트레이더를 위해 설계되었습니다. 최대 세 개의 일간 이동 평균을 더 작은 타임프레임 차트에 직접 계산하고 표시하여 낮은 간격에서 거래할 때 일간 추세 동향을 명확하게 볼 수 있습니다.
주요 특징:
- 세 개의 일간 이동 평균이 동시에 표시되어 향상된 추세 분석 제공
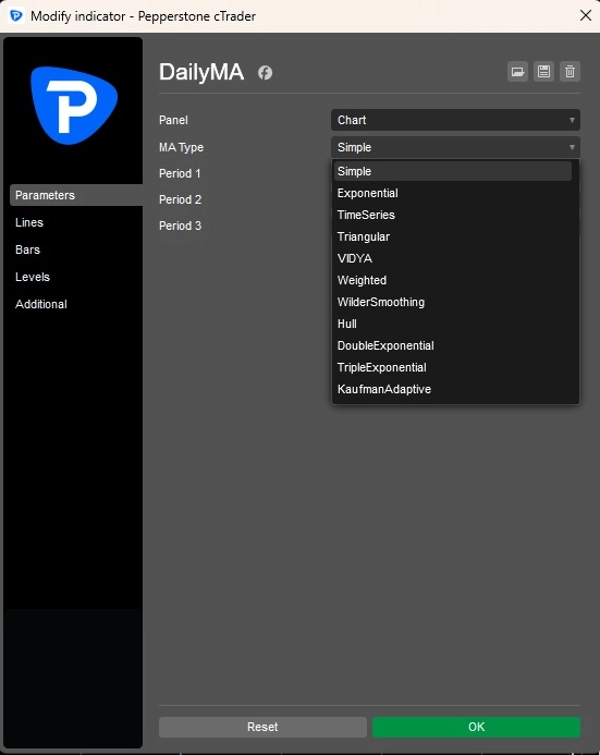
- 선택 가능한 이동 평균 유형(SMA, EMA, WMA 등) 각 선별로 설정 가능
- 차트 타임프레임에 관계없는자동 일간 계산
- 미니멀리스트 디자인 — 일관성과 명확성을 위한 고정 색상 및 스타일
이 지표는 일간 레벨에 의존하여 일중 결정을 내리는 트레이더에게 이상적이며, 불필요한 사용자 지정 없이 상위 타임프레임 컨텍스트를 간단하면서도 강력하게 유지할 수 있는 방법을 제공합니다.
요약
지표 프로필
고객 리뷰
5.0
리뷰: 1
5 | 100 % | |
4 | 0 % | |
3 | 0 % | |
2 | 0 % | |
1 | 0 % |
상담
자주 묻는 질문(FAQ)
Signal
Indices
Commodities
GBPUSD
RSI
Bollinger
Fibonacci
Scalping
XAUUSD
NAS100
MACD
BTCUSD
Forex
Breakout
EURUSD
NZDUSD
Prop
ZigZag
Supertrend
Fair Value Gap
SMC
Crypto
Stocks
ATR
USDJPY
VWAP
트레이딩 봇, 지표, 플러그인 등 cTrader Store에서 제공되는 상품은 제3자 개발자에 의해 제공되며, 이는 단순히 정보 및 기술적 접근을 목적으로 제공된 것입니다. cTrader Store는 중개인이 아니며, 투자 조언, 개인별 추천 또는 향후 성과에 대한 어떠한 보장도 제공하지 않습니다.
이 작성자의 상품 더 보기


좋아하실 만한 다른 항목


!["[Hamster-Coder] Pivot Points MTF" 로고](https://cdn.ctrader.com/image/webp/4c143e5a-309c-40e3-a578-f04d1e133ffa_31159)


가격
가입일 24/04/2025
166.96M
거래량
17.73K
핍 수익
11
판매
328
무료 설치