
ORB v1
อินดิเคเตอร์
3 การซื้อ
เวอร์ชัน 1.0, Jun 2025
Windows, Mac
5.0
รีวิว: 2
คำอธิบาย
ปลดล็อกโครงสร้างตลาดที่ทรงพลังด้วยเครื่องมือ Opening Range Breakout ที่สะอาดและปรับแต่งได้นี้
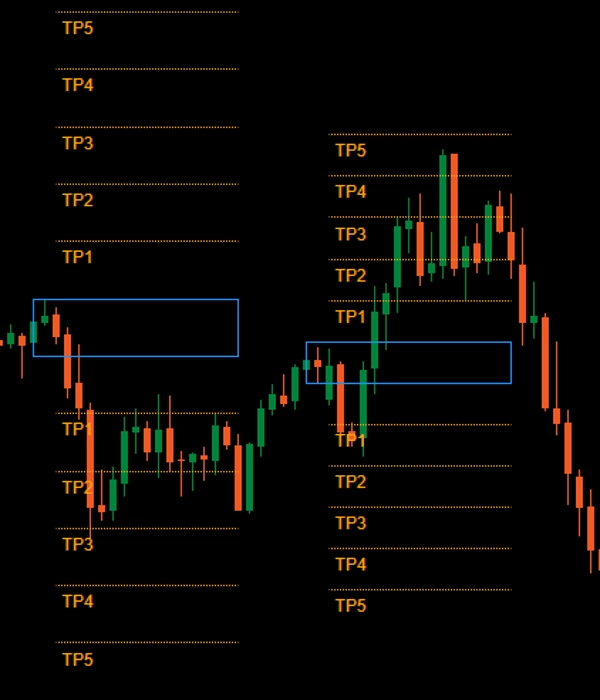
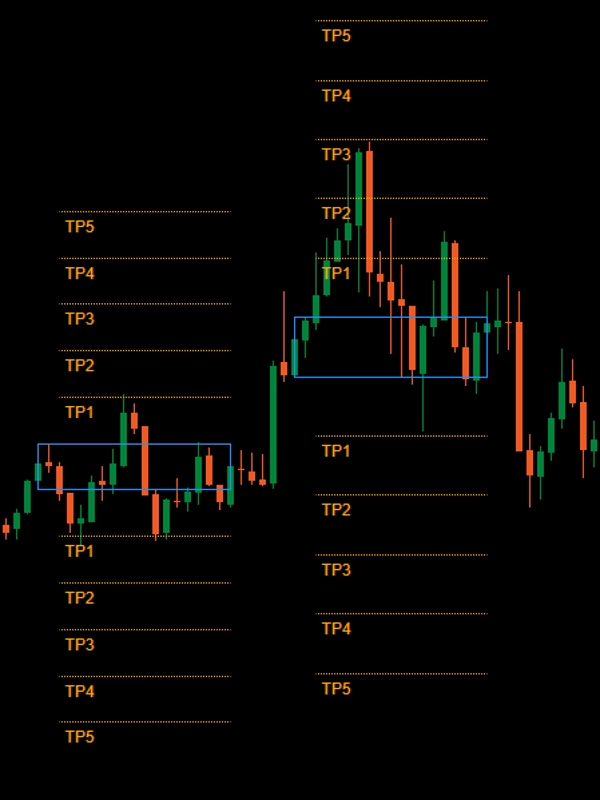
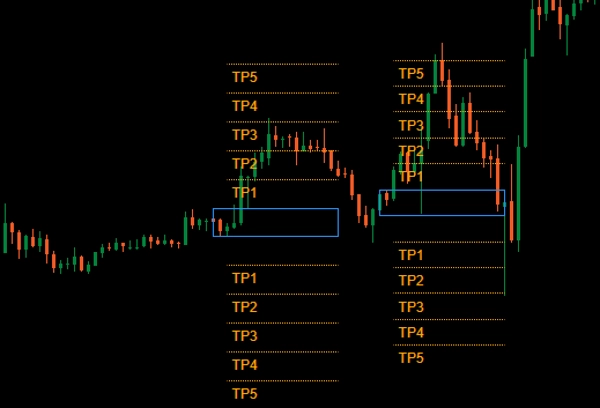
วาดกล่องเบรกเอาต์สองช่วงเวลา พร้อมระดับทำกำไรที่เลือกได้ เหมาะสำหรับเทรดเดอร์ที่ใช้ ORB หรือการตั้งค่าตามความผันผวน
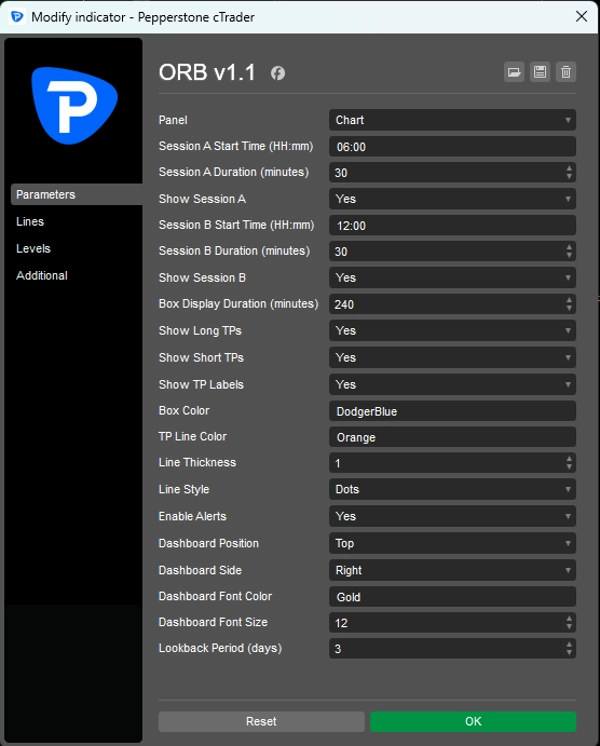
🕐 กำหนดเวลาช่วงเวลาที่กำหนดเอง
📦 แสดงกล่องเบรกเอาต์ที่สะอาด
🎯 แสดงระดับ TP (1R–5R) พร้อมตัวเลือกการจัดแต่ง
🎨 สี ป้ายชื่อ และสไตล์เส้นที่ปรับแต่งได้เต็มที่
🧭 เรียบง่าย รวดเร็ว และไม่รก – สิ่งที่คุณต้องการ
เหมาะสำหรับการดำเนินกลยุทธ์ด้วยตนเองหรือผสมผสานกับตรรกะของคุณเอง
สรุป
สรุปโดย AI
ORB v1 is an indicator tool designed for Opening Range Breakout (ORB) trading strategies. It visually represents market structure by drawing breakout boxes for two custom-defined trading sessions. The tool supports customizable session times and displays clean breakout boxes on the chart. It includes optional take-profit (TP) levels ranging from 1R to 5R, with configurable styling options such as colors, labels, and line styles. The indicator is streamlined for simplicity and speed, minimizing chart clutter. It is suitable for traders executing manual strategies or integrating with their own trading logic, particularly those using ORB or volatility-based setups.
โปรไฟล์อินดิเคเตอร์
รีวิวจากลูกค้า
5.0
รีวิว: 2
5 | 100 % | |
4 | 0 % | |
3 | 0 % | |
2 | 0 % | |
1 | 0 % |
รีวิวจากลูกค้า
February 25, 2026
ORB v1 is a clean and practical Opening Range Breakout tool with dual-session boxes and clearly calculated 1R-5R TP levels. No clutter, no unnecessary panels - just precise range structure and breakout levels. Works best on M10-H1 and higher. Perfect for traders who execute ORB strategies manually or integrate it into their own volatility logic.
June 29, 2025
Two timeframes give more context, and the setup has to clear another checkpoint.
การสนทนา
คำถามที่พบบ่อย
Breakout
ผลิตภัณฑ์ที่มีให้บริการผ่าน cTrader Store รวมถึงบอทการเทรด อินดิเคเตอร์ และปลั๊กอิน มีให้บริการโดยนักพัฒนาบุคคลที่สามและมีไว้เพื่อวัตถุประสงค์ในการเข้าถึงข้อมูลและทางเทคนิคเท่านั้น cTrader Store ไม่ใช่โบรกเกอร์และไม่ได้ให้คำแนะนำการลงทุน คำแนะนำส่วนบุคคล หรือการรับประกันผลการดำเนินงานในอนาคต
เพิ่มเติมจากผู้เขียนคนนี้


!["[Stellar Strategies] Market Session Ultimate" โลโก้](https://cdn.ctrader.com/image/webp/61ffd537-0125-4246-9e72-42eca1791d64_28232)


ราคา
ตั้งแต่ 24/04/2025
163.54M
ปริมาณการเทรด
17.61K
Pips ที่ได้กำไร
11
การขาย
328
ติดตั้งฟรี