


คำอธิบาย
แนวคิด
ค่าเฉลี่ยเคลื่อนที่ที่ ปรับตัวตามการพัฒนาของแนวโน้ม แทนที่จะบังคับให้แนวโน้มอยู่ในช่วงเวลาคงที่
ปัญหา
ค่าเฉลี่ยเคลื่อนที่ส่วนใหญ่ต้องการช่วงเวลาย้อนหลังที่คงที่
แต่แนวโน้มไม่ได้พัฒนาในช่วงเวลาคงที่
ช่วงเวลาสั้นตอบสนองได้รวดเร็ว แต่สามารถถูกรบกวนได้ง่ายจากการเคลื่อนไหวระยะสั้น
ช่วงเวลายาวช่วยลดเสียงรบกวนได้มากขึ้น แต่สามารถล่าช้าอย่างมากเมื่อราคาขยับอย่างแรง
ปัญหาไม่ใช่การเลือกช่วงเวลาที่ “ถูกต้อง”
ปัญหาคือช่วงเวลานั้นคงที่ในขณะที่แนวโน้มกำลังพัฒนาอย่างต่อเนื่อง
แนวคิดหลัก: แนวโน้มกำหนดช่วงเวลา ค่าเฉลี่ยเคลื่อนที่ปรับตัวตามนั้น
ค่าเฉลี่ยเคลื่อนที่แบบดั้งเดิมใช้ ช่วงเวลา เป็นข้อมูลอ้างอิงหลัก
Supertrend Moving Average ใช้ โครงสร้างแนวโน้ม เป็นข้อมูลอ้างอิงหลัก
แทนที่จะถามว่า:
“ควรใช้ช่วงเวลา MA คงที่ใด?”
ตัวชี้วัดถามว่า:
“แนวโน้มปัจจุบันพัฒนาไปอย่างไรบ้าง?”
แนวโน้มกำหนดจุดเริ่มต้นของ MA ที่ปรับตัวและวิธีการพัฒนาความยาวที่มีประสิทธิภาพตามเวลา
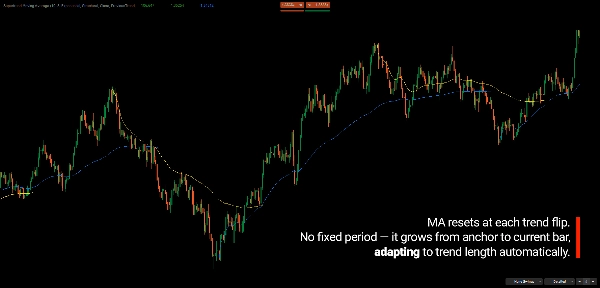
เมื่อแนวโน้มใหม่เริ่มต้น MA จะยึดติดกับจุดสุดขั้วโครงสร้างของแนวโน้มก่อนหน้าและพัฒนาต่อไปจากจุดนั้น เมื่อแนวโน้มใหม่ดำเนินต่อไป ความยาวที่มีประสิทธิภาพจะเพิ่มขึ้นตามจำนวนแท่งที่พัฒนาจากจุดยึด
แนวโน้มกำหนดโครงสร้าง ค่าเฉลี่ยเคลื่อนที่ปรับตัวตามนั้น
สิ่งที่ทำ
ตัวชี้วัดปรับความยาว MA ที่มีประสิทธิภาพอย่างไดนามิกตามการพัฒนาของแนวโน้มปัจจุบัน
แนวโน้มที่เพิ่งระบุเริ่มต้นด้วยความยาวที่มีประสิทธิภาพสั้นกว่า ทำให้ MA ตอบสนองได้รวดเร็วขึ้น
เมื่อแนวโน้มดำเนินต่อไป ความยาวที่มีประสิทธิภาพจะยาวขึ้น ทำให้ MA มีความเรียบมากขึ้นอย่างต่อเนื่อง
MA ไม่ได้คำนวณจากจำนวนแท่งล่าสุดที่คงที่เท่านั้น การคำนวณจะพัฒนาจากจุดยึดโครงสร้างที่กำหนดโดยแนวโน้มก่อนหน้า
เมื่อแนวโน้มเปลี่ยนแปลง ข้อมูลอ้างอิงโครงสร้างจะรีเซ็ตและเริ่มการวัดแบบปรับตัวใหม่
สิ่งนี้สร้างค่าเฉลี่ยเคลื่อนที่ที่เปลี่ยนพฤติกรรมตามสิ่งที่แนวโน้มได้ทำไปแล้ว
มันไม่ได้พยายามทำนายว่าแนวโน้มถัดไปจะยาวนานแค่ไหน
มันปรับตัวตามระยะเวลาและโครงสร้างที่ได้พัฒนาไปแล้ว
วิธีการทำงาน
- Supertrend ระบุแนวโน้มปัจจุบันและการเปลี่ยนแปลงโครงสร้าง
- ตัวชี้วัดระบุราคาปิดสุดขั้วของแนวโน้มก่อนหน้า
- จุดสุดขั้วโครงสร้างนั้นกลายเป็นจุดยึดสำหรับ MA ที่ปรับตัว
- เมื่อแนวโน้มใหม่พัฒนา จำนวนแท่งจากจุดยึดกำหนดความยาวที่มีประสิทธิภาพของ MA
- MA คำนวณใหม่โดยใช้ความยาวที่พัฒนานั้น
- เมื่อแนวโน้มเปลี่ยนแปลง ข้อมูลอ้างอิงโครงสร้างจะรีเซ็ตและกระบวนการเริ่มต้นใหม่
ความยาวที่ปรับตัวได้สามารถรวมกับวิธีการคำนวณค่าเฉลี่ยเคลื่อนที่ที่แตกต่างกันได้
สองมุมมองของแนวโน้ม
ตัวชี้วัดให้ข้อมูลอ้างอิง Supertrend สองแบบ:
Structural Supertrend
ข้อมูลอ้างอิงแนวโน้มที่กว้างขึ้นออกแบบมาเพื่อจับการเปลี่ยนแปลงโครงสร้างที่ใหญ่ขึ้นในขณะที่มีความไวต่อความผันผวนของราคาระยะสั้นน้อยลง
Original Supertrend
ข้อมูลอ้างอิงที่ตอบสนองได้รวดเร็วกว่า ซึ่งตอบสนองต่อการเคลื่อนไหวของราคาได้เร็วขึ้นและสามารถแสดงการเปลี่ยนแปลงโมเมนตัมระยะสั้นภายในแนวโน้มที่กว้างขึ้น
สองมุมมองนี้ไม่ได้มีไว้เพื่อเป็นสัญญาณอัตโนมัติ
ความสัมพันธ์ของพวกเขาให้บริบทเพิ่มเติมเกี่ยวกับการพัฒนาของแนวโน้ม
เมื่อทั้งสองข้อมูลอ้างอิงเคลื่อนที่ไปด้วยกัน พวกเขาให้มุมมองที่ชัดเจนขึ้นเกี่ยวกับการจัดแนวทิศทาง
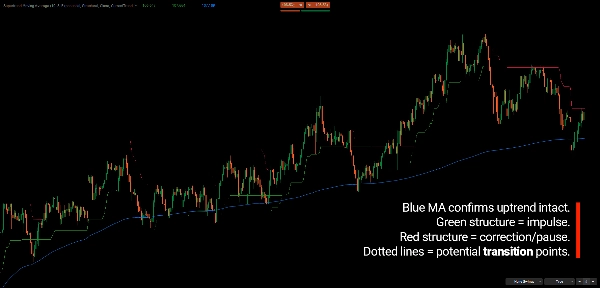
เมื่อพวกเขาแยกจากกัน ความแตกต่างนั้นสามารถให้บริบทสำหรับการแก้ไข การเปลี่ยนผ่าน หรือการเคลื่อนไหวระยะสั้นภายในแนวโน้มที่กว้างขึ้น
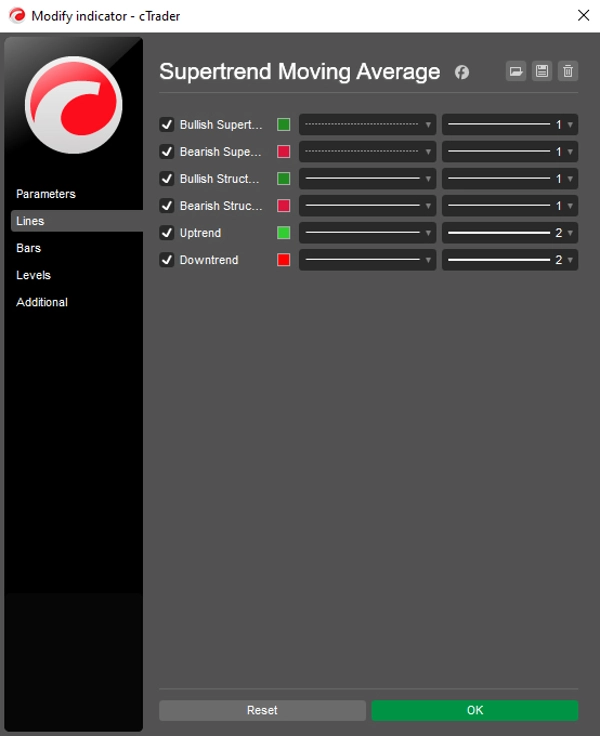
Original Supertrend (เส้นประ) วาดเฉพาะบนแท่งที่แตกต่างจาก Structural เท่านั้น ดังนั้นความแตกต่างจึงโดดเด่น มุมมองแต่ละแบบสามารถแสดงหรือซ่อนได้อย่างอิสระ
บริบทหลายกรอบเวลา
แนวโน้มที่ใช้ควบคุม MA ไม่จำเป็นต้องมาจากกรอบเวลาปัจจุบันของแผนภูมิ
ตัวอย่างเช่น แนวโน้มรายวันสามารถควบคุมค่าเฉลี่ยเคลื่อนที่ที่ปรับตัวซึ่งแสดงบนแผนภูมิ H1
สิ่งนี้ช่วยให้แนวโน้มกรอบเวลาที่สูงกว่ากำหนดพฤติกรรมการวัด ในขณะที่กรอบเวลาที่ต่ำกว่ามอบมุมมองรายละเอียดเพิ่มเติมของการพัฒนาราคา
Multi-timeframe (MTF) ครอบคลุมสามผลลัพธ์ แต่ละอันสามารถเปิดหรือปิดได้อย่างอิสระ:
- Moving Average – MA ที่ปรับตัวถูกขับเคลื่อนโดยแนวโน้ม HTF
- Supertrend – Structural และ Original Supertrend คำนวณบนแท่ง HTF และแมปไปยังแผนภูมิ อัปเดตทุกครั้งที่มีการเคลื่อนไหวขณะที่แท่ง HTF ยังสร้างอยู่
- Swing Points – การแกว่งและ S/R อัตโนมัติคำนวณบนแท่ง HTF ตัวบ่งชี้อยู่ที่จุดสุดขั้วราคาจริงภายในแท่ง HTF และการสวิง, การพลิก, และการยกเลิกจะถูกประเมินเมื่อแท่ง HTF ปิด ป้าย S/R และปลายเส้นยังอัปเดตในทุกแท่งของแผนภูมิ
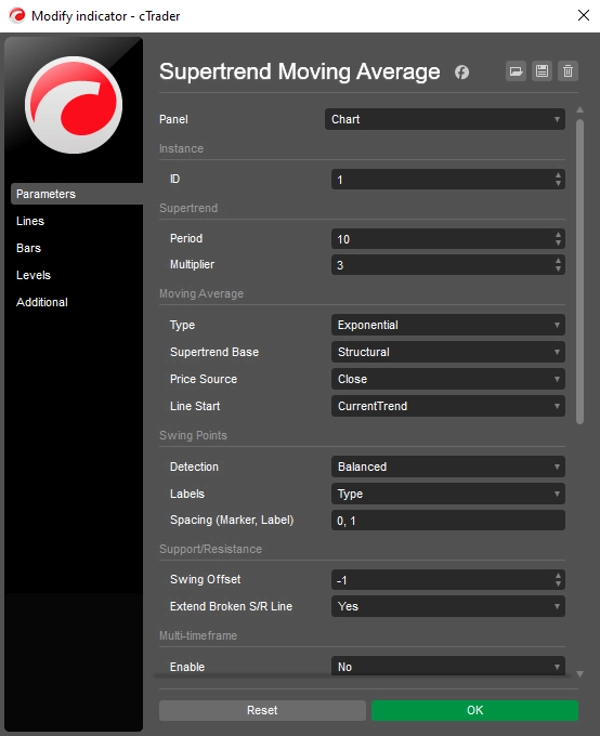
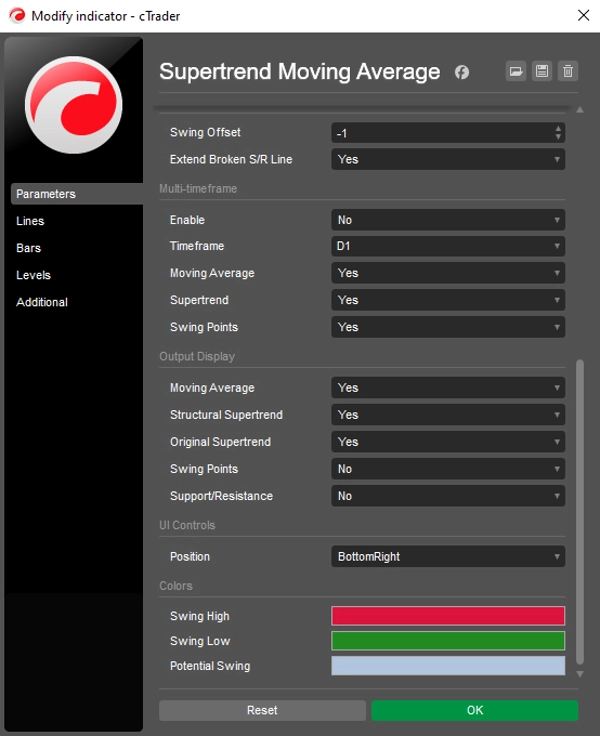
กลุ่มพารามิเตอร์ Multi-timeframe ประกอบด้วย เปิดใช้งาน, กรอบเวลา, และสวิตช์สำหรับ Moving Average, Supertrend, และ Swing Points แต่ละอัน MTF ปิดโดยค่าเริ่มต้น; เมื่อเปิดใช้งาน ผลลัพธ์ทั้งสามใช้กรอบเวลาที่เลือก เว้นแต่คุณจะปิดแต่ละอันแยกกัน
กรอบเวลา MTF สามารถสูงกว่า เท่ากับ หรือ ต่ำกว่ากรอบเวลาแผนภูมิ เมื่อมันต่ำกว่าหรือเท่ากับกรอบเวลาแผนภูมิ แท่งแผนภูมิแต่ละแท่งจะใช้แท่ง HTF ล่าสุดภายในนั้น (ค่าที่ปิดแท่งแผนภูมิ) และตัวบ่งชี้สวิงจะอยู่บนแท่งแผนภูมิที่มีการเปิดของแท่ง HTF
หมายเหตุ: MA HTF ประเมินแต่ละแท่ง HTF เมื่อมันปรากฏครั้งแรก ดังนั้นจึงไม่เปลี่ยนแปลงในขณะที่แท่งนั้นยังสร้างอยู่
การโหลดประวัติอัตโนมัติ
MA HTF ต้องการประวัติแผนภูมิที่เพียงพอเพื่อสร้างแนวโน้มกรอบเวลาที่สูงขึ้นใหม่ เมื่อแผนภูมิมีแท่งน้อยเกินไป ตัวชี้วัดจะร้องขอประวัติเพิ่มเติมเองและทำซ้ำจนกว่าจะตรงตามข้อกำหนด
คำเตือนบนแผนภูมิ ("โหลดแท่งเพิ่มอีก N แท่ง") จะปรากฏเฉพาะในกรณีสุดท้าย: เมื่อไม่มีประวัติเพิ่มเติม, คำขอล่าสุดไม่ได้เพิ่มข้อมูล, คำขอหมดเวลา, หรือข้อกำหนดมีขนาดใหญ่มาก
บริบทสวิงเสริม
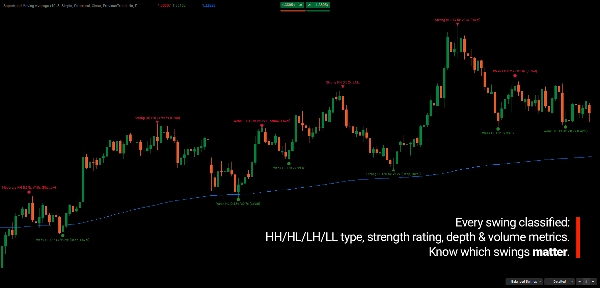
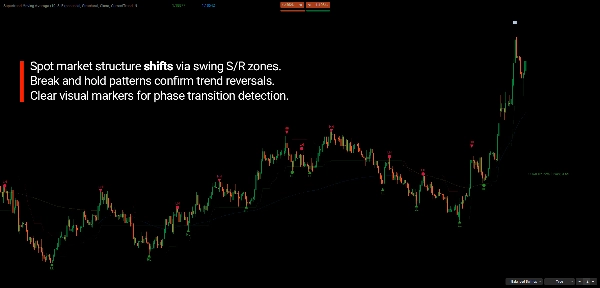
ตัวชี้วัดยังสามารถแสดงข้อมูลสวิง เช่น:
- HH / HL / LH / LL
- ความแข็งแกร่งของสวิง
- โซนสวิงและแนวรับ/แนวต้านอัตโนมัติ
- ขั้วสวิง
- ความสัมพันธ์ของสวิง
สิ่งเหล่านี้ให้รูปทรงราคาที่เพิ่มขึ้นรอบ MA ที่ปรับตัวโดยไม่เปลี่ยนแปลงการคำนวณหลัก
Swing Points และ S/R สามารถสลับเปิดปิดได้อย่างอิสระ (S/R ต้องการ Swing Points) ตัวเลือก S/R ของคุณจะถูกเก็บไว้ในขณะที่ Swing Points ปิด และจะใช้ใหม่เมื่อคุณเปิดอีกครั้ง
การแสดงผล
เลือกสิ่งที่จะแสดงอย่างแม่นยำ: MA, Structural Supertrend, Original Supertrend, Swings, และ Support/Resistance โดยค่าเริ่มต้น MA, Structural, และ Original เปิดอยู่; Swings และ S/R ปิดอยู่
- การซ่อนผลลัพธ์ยังข้ามการคำนวณของมันด้วย เมื่อปิด MA งาน MA ทั้งหมด (พื้นเมืองและ HTF รวมถึงการโหลดแท่ง HTF) จะถูกข้าม; เมื่อปิด Swings การตรวจจับและการแสดงผลสวิงจะถูกข้าม
- Original Supertrend แบบเส้นประยังคงปรากฏเฉพาะที่แตกต่างจาก Structural แม้เมื่อเส้น Structural ถูกซ่อน
- Swing Offset มีช่วงตั้งแต่ -100 ถึง -1 (ค่าเริ่มต้น -1) การแสดงหรือซ่อน S/R ถูกควบคุมโดยสวิตช์ S/R
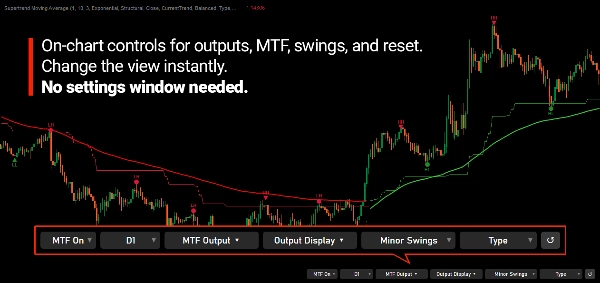
การควบคุมบนแผนภูมิ
เปลี่ยนสิ่งที่คุณเห็นโดยไม่ต้องเปิดกล่องโต้ตอบพารามิเตอร์ใหม่:
- การแสดงผล – ช่องทำเครื่องหมายสำหรับ MA, Structural Supertrend, Original Supertrend, Swings, และ Support/Resistance อย่างน้อยหนึ่งใน MA, Structural Supertrend, Original Supertrend หรือ Swings ต้องถูกเลือกไว้
- MTF – เปิด/ปิด, กรอบเวลา HTF, และผลลัพธ์ MTF (MA, Supertrend, Swings; อย่างน้อยหนึ่งต้องถูกเลือก) การเปลี่ยนแปลงจะมีผลทันทีโดยไม่ต้องโหลดตัวชี้วัดใหม่: MA, Supertrend, และสวิงจะถูกสร้างใหม่ตามต้องการ
- การควบคุมสวิง – โหมดตรวจจับ, การแสดงป้าย, และการชดเชย S/R เมื่อปิด Swings จะซ่อนและลบวัตถุสวิงและ S/R ออกจากแผนภูมิ; ปุ่มชดเชยจะปรากฏเฉพาะเมื่อทั้ง Swings และ S/R เปิดอยู่
- ปุ่มรีเซ็ต (↺) – คืนค่าการควบคุมทั้งหมด รวมถึง MTF และการควบคุมสวิง ไปยังค่าพารามิเตอร์ในกล่องโต้ตอบ
- การตั้งค่าที่บันทึก – ตัวเลือกบนแผนภูมิ (รวมถึง MTF และการควบคุมสวิง) จะถูกบันทึกต่อสัญลักษณ์และ Instance ID และเรียกคืนในครั้งถัดไป หากคุณเปลี่ยนพารามิเตอร์ในกล่องโต้ตอบ ค่านั้นจะมีความสำคัญเหนือค่าที่บันทึกไว้
- Instance ID – ใช้ ID ต่างกันเพื่อเก็บการตั้งค่าแยกสำหรับหลายอินสแตนซ์บนสัญลักษณ์เดียวกัน
- การสลับ – การเปิด MA จะสร้างใหม่ (พื้นเมืองและ HTF) และการปิดจะล้างมัน การสลับ Supertrend เพียงอย่างเดียวจะรีเฟรชผลลัพธ์ของมันเอง
สิ่งที่คุณสามารถสังเกตได้
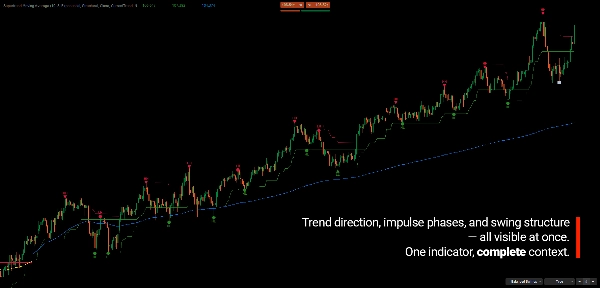
ตัวชี้วัดถูกออกแบบมาเพื่อแสดงหลายสิ่ง:
- ทิศทางแนวโน้มปัจจุบัน
- ระยะเวลาแนวโน้ม
- การเปลี่ยนแปลงในโครงสร้างแนวโน้ม
- การดึงกลับและการแก้ไข
- การดำเนินต่อหลังการแก้ไข
- บริบทกรอบเวลาที่สูงกว่า
- การเปลี่ยนแปลงพฤติกรรมราคารอบค่าเฉลี่ยที่ปรับตัว
MA เป็นเครื่องมือวัด ไม่ใช่ระบบซื้อ/ขายอิสระ
สร้างมาเพื่อการวัดที่ปรับตัว
จุดประสงค์ไม่ใช่การหาช่วงเวลา MA ที่สมบูรณ์แบบหนึ่งเดียว
แต่เพื่อขจัดสมมติฐานที่ว่าช่วงเวลาคงที่หนึ่งควรเหมาะสมตลอดช่วงชีวิตของแนวโน้ม
แนวโน้มใหม่และแนวโน้มที่โตเต็มที่เป็นขั้นตอนที่แตกต่างกันของการเคลื่อนไหวเดียวกัน
ค่าเฉลี่ยเคลื่อนที่ปรับตัวตามการพัฒนานั้นแทนที่จะปฏิบัติต่อทั้งสองขั้นตอนเหมือนกัน
เป้าหมายไม่ใช่การปรับแต่งช่วงเวลา MA คงที่อย่างต่อเนื่อง ช่วงเวลาจะพัฒนาโดยอัตโนมัติจากโครงสร้างแนวโน้มและการเคลื่อนไหวของราคาที่เกิดขึ้นแล้ว
คุณสมบัติหลัก
- MA ที่ปรับตัวตามโครงสร้างแนวโน้ม
- จุดยึดโครงสร้างตามราคาปิดสุดขั้วของแนวโน้มก่อนหน้า
- ความยาว MA ที่มีประสิทธิภาพพัฒนาตามแนวโน้มใหม่
- รีเซ็ตโครงสร้างอัตโนมัติเมื่อแนวโน้มเปลี่ยน
- หลายวิธีการคำนวณ MA
- มุมมอง Structural Supertrend
- มุมมอง Original Supertrend
- บริบทระหว่างมุมมองแนวโน้มโครงสร้างและตอบสนอง
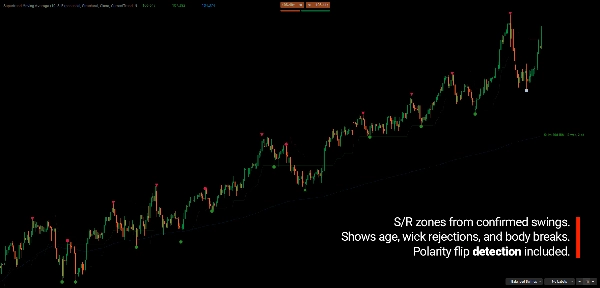
- ข้อมูลสวิงเสริมและ S/R อัตโนมัติ
- การจัดประเภท HH / HL / LH / LL
- ความแข็งแกร่งและโซนสวิง
- หลายกรอบเวลาสำหรับ MA, Supertrend, และ Swing Points แต่ละอันแยกกัน
- HTF สามารถต่ำกว่า เท่ากับ หรือสูงกว่ากรอบเวลาแผนภูมิ
- Supertrend HTF สดขณะที่แท่ง HTF กำลังสร้าง
- การควบคุมการแสดงผลและ MTF บนแผนภูมิโดยตรง
- ปุ่มรีเซ็ต, การตั้งค่าที่บันทึก, และ Instance ID
- การโหลดประวัติแผนภูมิอัตโนมัติสำหรับ MA HTF
- การแสดงผลที่ปรับแต่งได้
สิ่งที่ควรรู้
- MA HTF ประเมินแต่ละแท่ง HTF เพียงครั้งเดียวเมื่อมันปรากฏครั้งแรก ดังนั้นจึงไม่เปลี่ยนแปลงในขณะที่แท่งนั้นยังสร้างอยู่ Supertrend HTF จะอัปเดตสด
- คำเตือน "โหลดแท่งเพิ่มอีก N แท่ง" และการโหลดประวัติอัตโนมัติใช้กับ MA HTF เท่านั้น
- ระยะห่างสวิงเป็นค่าพิปคงที่ ดังนั้นบนสวิง HTF การชดเชยตัวบ่งชี้อาจดูเล็ก
- การคำนวณสวิงใหม่ทำงานบนเธรด UI ดังนั้นแผนภูมิที่มีประวัติยาวมากอาจหยุดชั่วคราวเมื่อคำนวณสวิงใหม่
- สวิงที่ถูกตัดจากประวัติ 100 สวิงยังคงเก็บวัตถุแผนภูมิของพวกมันไว้
---
ตัวชี้วัดนี้เป็นเครื่องมือสำหรับการวิเคราะห์ตลาดและไม่ได้ให้คำแนะนำทางการเงินหรือรับประกันผลลัพธ์การซื้อขาย
สรุป
The indicator integrates dual Supertrend analyses: a Structural Supertrend that identifies major trend direction by filtering out noise and confirming genuine directional changes, and the Original Supertrend that highlights momentum shifts within the trend. Comparing these two provides context for distinguishing strong trend continuation from corrective movements.
Key features include:
- Adaptive anchor-based moving averages with options for Simple, Exponential, or Arnaud Legoux (ALMA) types.
- Multi-timeframe capability to apply higher timeframe Supertrend context on lower timeframe charts.
- Integrated swing detection with configurable modes and strength classification.
- Color-coded trend lines and swing markers for clear visual interpretation.
This tool is suited for trend and swing traders, multi-timeframe analysts, and discretionary traders seeking a structural framework to track trend development and market rhythm objectively. It emphasizes market structure and context over fixed signals, supporting clearer interpretation of price behavior.
รีวิวจากลูกค้า
5 | 67 % | |
4 | 33 % | |
3 | 0 % | |
2 | 0 % | |
1 | 0 % |
การสนทนา
คำถามที่พบบ่อย























ราคา