

Description
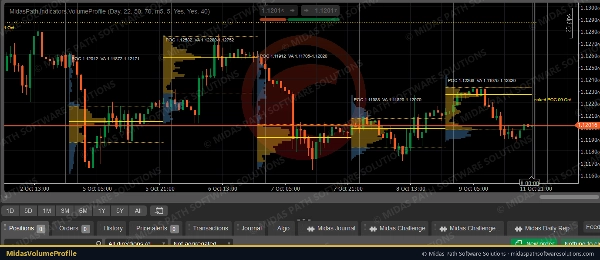
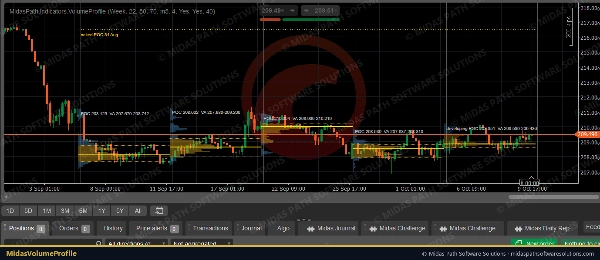
Midas Volume Profile shows where volume traded in each day or week, drawn as a histogram at the start of the session, with the levels profile traders use.
What it shows
• A volume histogram for each session, with the value area highlighted.
• POC (point of control): the price row with the most volume, drawn across the session.
• Value area high and low (VAH / VAL): the range around the POC that holds 70% of the session's volume (adjustable).
• Naked POCs: earlier sessions' POCs that price has not traded through since, extended to the right until price touches them.
• The developing profile of the current session, updated as each candle closes.
How it is built
• Volume is cTrader's tick volume (the number of price updates), the usual measure in forex and CFDs, where there is no central exchange volume. It is taken from a lower timeframe (5 minutes by default) for detail.
• Each candle's volume is shared across the price rows its high-low range covers, in proportion to the overlap. The session's range is split into 50 rows (adjustable).
• The value area grows from the POC towards whichever neighbouring row holds more volume, until it holds the chosen share.
Settings
• Profiles per day or per week, session start hour (22:00 UTC by default, the forex day), rows, value-area share, volume timeframe.
• Number of sessions shown, developing session on or off, naked POCs on or off, histogram width and colours.
Tested
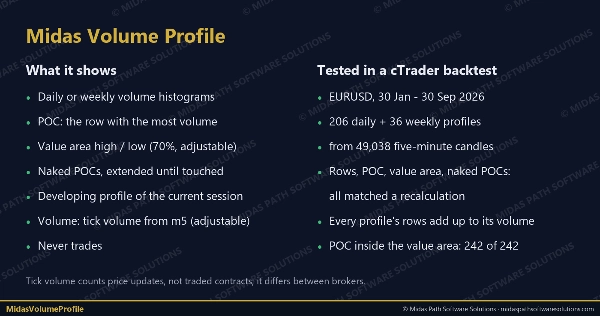
• In a cTrader backtest on EURUSD (30 Jan-30 Sep 2026), all 206 daily and 36 weekly profiles built from 49,038 five-minute candles matched an independent recalculation: session boundaries, every row's volume (each profile's rows add up to its total volume), POC, value area and every naked-POC touch.
• On that data the POC sat inside the value area in every profile, the value area held 71% of volume on average (rows are whole, so it slightly exceeds 70%), and 10 daily and 2 weekly POCs were still naked at the end.
Notes
• Tick volume counts price changes, not traded contracts; it differs between brokers.
• Volume profiles describe where trading happened; they do not predict where price will go.
• It never trades and needs no internet or file access.
Summary
Key features include:
- Point of Control (POC): the price level with the highest traded volume, extended across the session.
- Value Area High and Low (VAH/VAL): price range around the POC containing approximately 70% of the session’s volume, adjustable by the user.
- Naked POCs: POCs from previous sessions that price has not revisited, extended until touched.
- A developing profile for the current session, updated with each candle close.
The indicator calculates volume by distributing each candle’s tick volume proportionally across price rows within its high-low range, dividing the session range into adjustable rows (default 50). It supports profiles per day or week, customizable session start times, and visual settings such as histogram width and colors.
Midas Volume Profile operates without trading or internet access and has been tested for accuracy against independent recalculations on EURUSD data. It provides a detailed view of where trading activity concentrates but does not predict price direction.
Discussion
Customer reviews
FAQ
More from this author












Price
