
Description
WHAT IT DOES
Draggable Moving Average anchors a moving average to any point in price history — not from bar zero, not from a fixed lookback, but from exactly where you place it.
Standard moving averages start from the beginning of chart data and converge over time. Their period is fixed. Their starting reference is arbitrary. When you want to measure how price has evolved since a specific structural event — a corrective start, an impulse beginning, a key swing — there is no way to anchor the MA to that moment.
This indicator solves that.
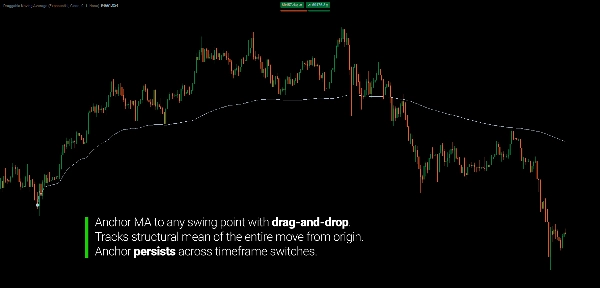
Place the anchor icon on any bar. The MA starts from that bar and extends forward. Drag the icon to a different bar — the MA instantly recalculates from the new position. Switch timeframes — the anchor holds, the MA recalculates automatically on the new chart.
The result is a moving average that always reflects how price has evolved from a specific structural point you define.
THE CORE BENEFIT
Standard Approach:
- Identify the start of a corrective or impulse move
- Apply a fixed-period MA — it starts from chart beginning, not your structure
- Adjust period manually to approximate the structure's length
- Switch timeframes — period becomes meaningless in different bar counts
- Repeat every time structure changes
Draggable Approach:
- Place anchor at the start of the structure
- MA calculates forward from that exact bar
- Switch timeframes — anchor holds, MA recalculates automatically
- Drag to adjust — everything updates instantly
The difference is structural. Instead of approximating a reference point through period adjustments, you define it directly. The structural point is the input — not the period.
ANCHORED TO STRUCTURE: MEAN REVERSION AND REVERSAL DETECTION
When a moving average starts from a structural swing point — the origin of a trend, the beginning of an impulse, or the start of a correction — it stops being an arbitrary smoothing line and starts behaving as a structural mean.
Price organizes around that mean in predictable ways:
- During the move, price oscillates around the anchored MA — pulling away during momentum bursts, returning to the MA during consolidation. The MA reflects the average price of the entire structure from its origin, not just recent bars.
- At exhaustion, price begins crossing the anchored MA rather than bouncing from it. A close below an upward-sloping anchored MA — one that has tracked an impulse from its origin — carries structural significance. The mean of the entire move is being violated.
- After reversal, the anchored MA becomes resistance. Retests of the MA from below mark logical areas where the prior structural mean acts as supply.
This behavior is consistent because the MA is measuring the right thing: the average price of a specific structural move from its actual starting point, not from an arbitrary period ago.
SUPPORTED MA TYPES
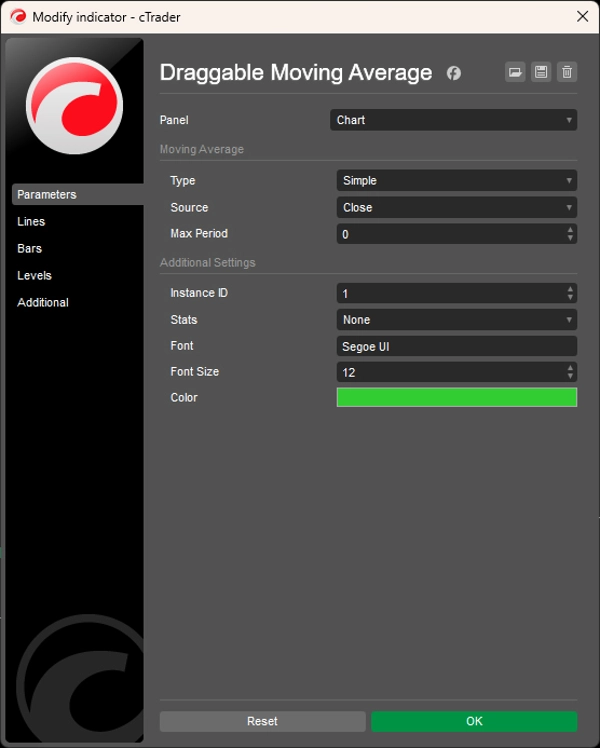
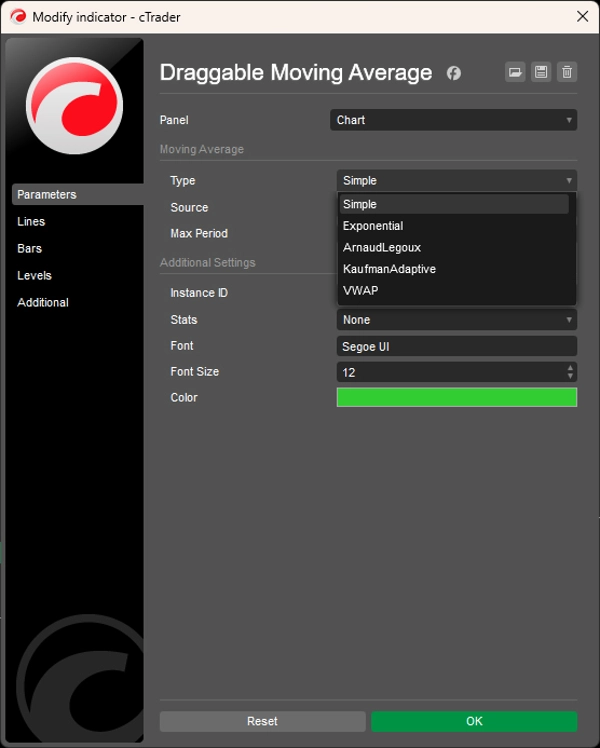
Five calculation methods, selectable per instance:
- Simple (SMA) — arithmetic mean from anchor forward; grows with each bar until Max Period is reached
- Exponential (EMA) — exponentially weighted; more responsive to recent price action
- Arnaud Legoux (ALMA) — Gaussian-weighted; reduces lag without amplifying noise
- Kaufman Adaptive (KAMA) — dynamically adjusts smoothing based on market efficiency ratio; tightens during trending conditions, widens during consolidation
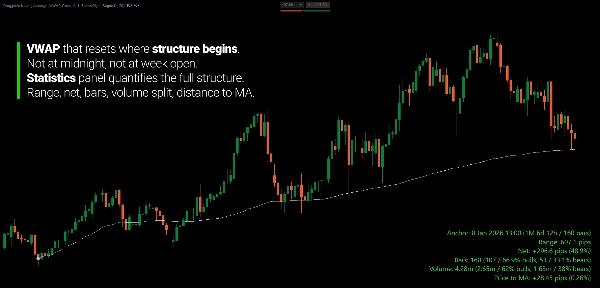
- VWAP — volume-weighted average from anchor; reflects where most volume has transacted since the structural point
All types respect the Max Period parameter — cap the lookback window while keeping the anchor as the origin reference.
STATISTICS PANEL
Optional overlay panel, selectable in four corner positions, displays real-time metrics from anchor to current bar:
- Range in pips (highest high to lowest low)
- Net change in pips and percentage
- Total bars with bullish/bearish count and percentages
- Total volume with bullish/bearish split and percentages
- Current price distance from MA in pips and percentage
- Duration and bars counter from anchor bar to current bar
Useful for quantifying the exact structure you've anchored to — not just the MA line, but the full statistical profile of the price move from origin to now.
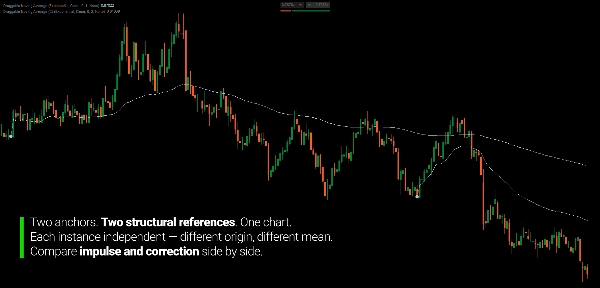
MULTI-INSTANCE SUPPORT
Each instance carries a unique Instance ID. Multiple instances can run simultaneously — one anchored to the start of a correction, another to the prior impulse — without icon or label conflicts.
KEY FEATURES
- Draggable anchor icon — place on any bar, drag to adjust, MA updates instantly
- Five MA types (SMA, EMA, ALMA, KAMA, VWAP)
- Eight price sources (Open, High, Low, Close, Average, Median, Typical, Weighted)
- Max Period cap with rolling window from anchor origin
- Optional statistics panel with four corner positions
- Multi-instance support with unique Instance IDs
- Persistent anchor across timeframe switches
WHO IT'S FOR
This indicator is for traders who analyze market structure across timeframes — specifically those who want to measure price behavior from a defined structural reference point rather than an arbitrary lookback period.
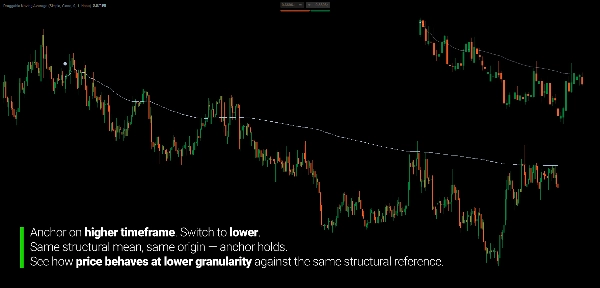
If you analyze corrective and impulse legs on higher timeframes and need to evaluate that same structure at lower timeframe granularity, the draggable anchor lets you mark the structural starting point once and carry it across timeframe views. Anchor on the Daily chart, switch to M15 — the reference holds.
It suits swing and position traders who think in structural moves rather than fixed periods, multi-timeframe analysts who need consistent reference points across charts, and discretionary traders who want precise, user-defined MA anchoring without period guessing.
This is not a signal system. It is a structural measurement tool for traders who already think in terms of price moves and want their moving average to reflect those moves precisely.
WHAT MAKES IT DIFFERENT
Standard moving averages are period-based. Their reference is implicit — n bars back from the current bar. When a structural move ends and a new one begins, the period becomes irrelevant. You cannot point a standard MA at a specific event.
This indicator makes the reference explicit. You anchor to a structural event. The MA measures from there. The period is not the input — the structural point is.
The result: a moving average that reflects your actual structural analysis rather than an approximation of it.
---
UNDERSTANDING THE MOVING AVERAGE AS A STRUCTURAL MEAN
Moving averages are widely misunderstood as support and resistance levels. Traders wait for price to "respect" the 50 MA or bounce from the 200 MA as if those numbers carry inherent market significance. They don't.
A moving average is an arithmetic description of a distribution — the average price over a defined window. What determines whether that line is meaningful is not the formula. It is whether the window being measured has structural relevance.
This is why period-based MAs are fundamentally limited. A 50-period MA measures the last 50 bars — a window with no relationship to any structural event. It does not correspond to where a trend began or where a correction started. It is a rolling window of arbitrary length whose position is determined by recency alone.
When you anchor to a structural swing point, the MA becomes the mean of a specific, coherent price distribution from that origin forward. When price deviates far above it, participants who entered at the origin are extended. When price returns to it, that reflects rebalancing of the distribution. When price breaks through it cleanly, the average participant from the structural origin is at breakeven or in loss — a statistical regime change, not a line being broken.
The geometry is not the cause. It is the statistical description of a structural distribution whose boundaries you have defined.
---
Trading involves risk. This indicator is a technical analysis tool—always apply proper risk management.
Summary
This approach transforms the MA into a structural mean that reflects the average price evolution from a defined origin, aiding in mean reversion and reversal detection. Price behavior around this anchored MA provides insights into momentum, consolidation, and potential trend exhaustion.
The indicator supports five MA calculation methods—Simple (SMA), Exponential (EMA), Arnaud Legoux (ALMA), Kaufman Adaptive (KAMA), and Volume Weighted Average Price (VWAP)—with a configurable maximum period to cap the lookback window. It offers eight price source options and an optional statistics panel displaying real-time metrics such as range, net change, volume splits, and price distance from the MA.
Multiple instances can run simultaneously, each with a unique ID, allowing concurrent analysis of different structural moves without conflicts. This tool is designed for swing and position traders, multi-timeframe analysts, and discretionary traders who require precise, structure-based MA anchoring rather than arbitrary period-based averages.


!["Gaussian Channel [Iridio Capital]" logo](https://cdn.ctrader.com/image/webp/7c039209-5573-4a54-a072-f9528b503103_41960)


