


Description
THE IDEA
A Supertrend that waits for a structural change instead of treating every close beyond the band as a trend reversal.
THE PROBLEM
Classic Supertrend is highly responsive to price.
When price closes beyond the Supertrend band, the trend can immediately flip.
But a price move beyond the band does not necessarily mean that the broader price geometry has changed.
A single candle can move against the trend without changing how the trend is developing.
The problem is not that Supertrend reacts to price. The problem is treating every band break as a structural change.
THE CORE CONCEPT: PRICE CAN BREAK THE BAND WITHOUT BREAKING THE TREND.
Structural Supertrend separates a price break from a structural change.
A close beyond the Supertrend band is treated as a potential change.
The indicator evaluates the surrounding swing structure using qualified swing points rather than treating every local extremum as meaningful.
This shifts the question from:
“Did price break the band?”
to:
“Did the underlying price geometry actually change?”
Price can break the band without breaking the trend.
WHAT IT DOES
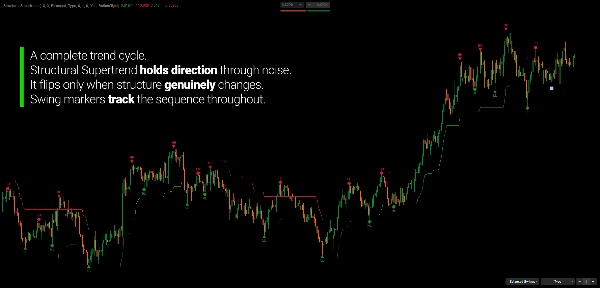
Structural Supertrend combines Supertrend bands with swing-based structural analysis.
When price moves beyond the band, the indicator evaluates whether the broader swing structure supports a trend change.
If the structural conditions are not met, the existing trend can remain intact.
If the required structural change occurs, the Supertrend changes accordingly.
This makes the trend reference less dependent on an individual candle and more connected to the development of price geometry.
FROM PRICE BREAK TO STRUCTURAL CHANGE
The process can be viewed in three stages:
- Price moves beyond the Supertrend band.
- The swing structure is evaluated.
- The trend changes only when the structural conditions are satisfied.
A band break is therefore information.
It is not automatically treated as a reversal.
TWO SUPERTREND VIEWS. ONE CHART.
The indicator can display both:
Structural Supertrend
The structure-aware trend reference.
Original Supertrend
The more reactive conventional Supertrend.
When the two disagree, the difference itself becomes useful context.
For example, the Original Supertrend may change while the Structural Supertrend remains unchanged.
That does not automatically mean reversal or continuation.
It simply shows that price has moved against the broader structural reference without yet producing the required structural change.
THE SWING MAP
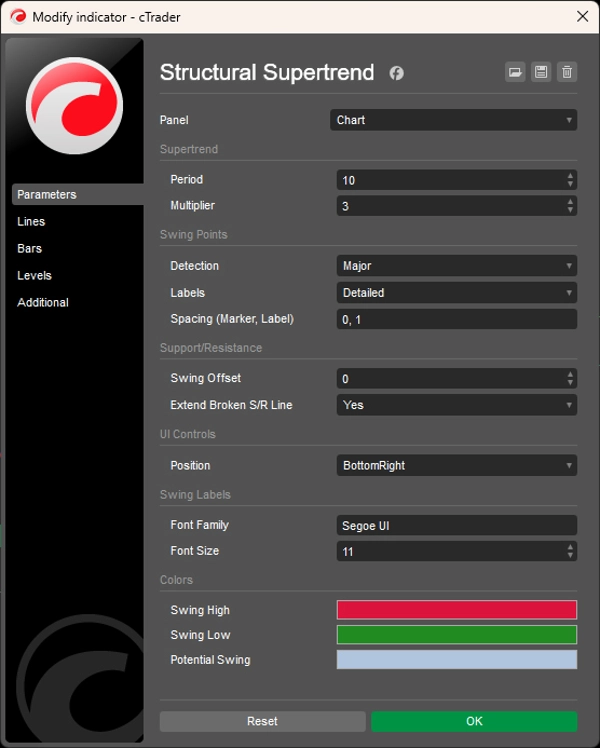
Structural Supertrend includes integrated swing detection with three sensitivity levels:
- Minor
- Balanced
- Major
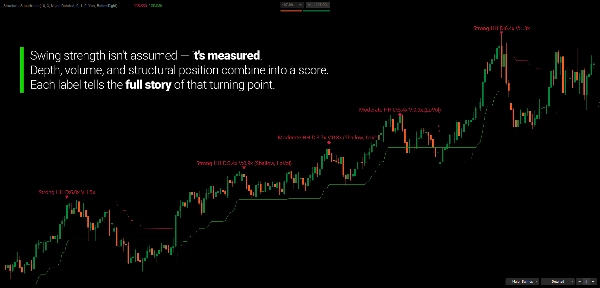
Each confirmed swing is evaluated through:
- Swing depth
- Tick volume
- Structural position relative to previous swings
This swing map provides the structural reference used to evaluate potential trend changes.
SUPPORT & RESISTANCE THAT REMEMBERS
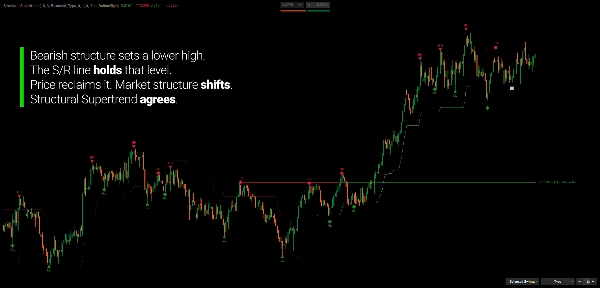
Detected swing levels can also function as dynamic support and resistance references.
The indicator can track characteristics such as:
- Number of tests
- Level age
- Wick rejection
- Body break
- Polarity changes
- Invalidation
Instead of treating every level as an isolated horizontal line, the level retains information about how price has interacted with it.
READ THE RELATIONSHIP, NOT JUST THE COLOR
The Supertrend color is only one part of the picture.
More useful observations can come from the relationship between:
- Price and the Supertrend band
- Original and Structural Supertrend
- Current swings and previous swings
- Support/resistance and current price
- Lower-timeframe movement and higher-timeframe context
The indicator is designed to keep these relationships visible rather than compressing them into a single signal.
STRUCTURE WITHOUT THE NEED TO PREDICT
The indicator does not attempt to predict whether the next move will reverse or continue.
It waits for price to provide more information.
A movement against the trend can remain a movement against the trend until the underlying geometry changes.
This makes the indicator useful for observing how trends actually develop rather than trying to anticipate every possible reversal.
MULTIPLE TIMEFRAMES
Structural Supertrend can be used across timeframes to compare trend development at different scales.
A higher-timeframe structural trend can provide context while the current timeframe reveals the smaller movements developing inside it.
This makes it possible to observe corrections, continuation, and potential structural changes without treating every lower-timeframe movement as a new trend.
BUILT FOR STRUCTURAL CONTEXT
Use Structural Supertrend to study:
- Trend direction
- Structural changes
- Pullbacks and corrections
- Price movement beyond the band
- Swing relationships
- Support and resistance behavior
- Original vs structural Supertrend divergence
- Higher-timeframe trend context
It is not designed as an automatic buy/sell system.
The purpose is simple:
Has the trend actually changed, or did price simply move against it?
KEY FEATURES
- Structure-aware Supertrend
- Original Supertrend reference
- Structural confirmation
- Integrated swing detection
- Minor / Balanced / Major sensitivity
- Swing depth
- Tick-volume context
- Swing strength
- Dynamic support and resistance
- Level testing and age
- Wick rejection
- Body-break detection
- Polarity changes
- Level invalidation
- Multi-timeframe analysis
- Customizable display
---
Trading involves risk. This indicator is a technical analysis tool and should be used together with appropriate risk management.
Summary
The indicator integrates a comprehensive swing detection and support/resistance (S/R) framework. Swings are qualified based on displacement, volume, and ATR-relative distance, and scored dynamically for strength using recent swing history. Users can select among three detection modes—Minor, Balanced, and Major—to adjust sensitivity. Confirmed swings generate active S/R zones that track interaction history, including polarity flips when levels are breached, and display age and test counts.
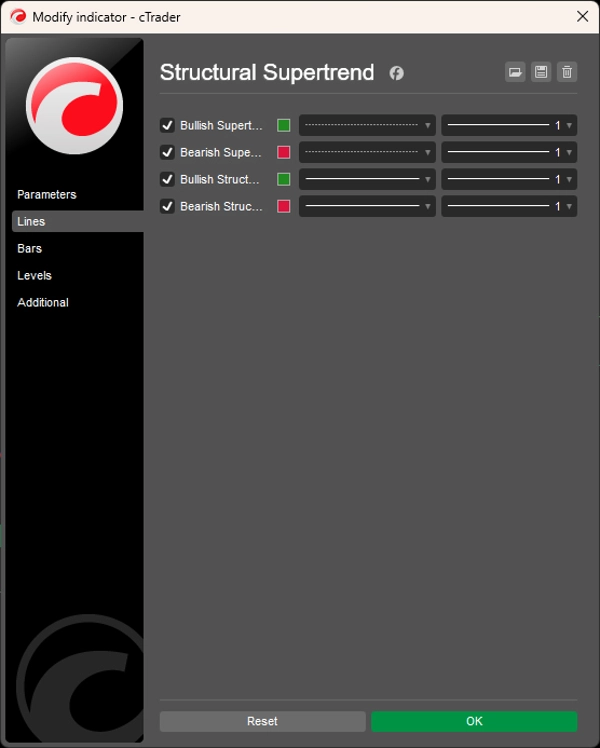
On the chart, the Structural Supertrend line indicates the major trend direction (green for bullish, red for bearish), while the original Supertrend appears only where it diverges, highlighting impulse or corrective phases. This dual-layer view aids in distinguishing strong directional moves from transitional market phases.
Structural Supertrend is intended for trend, swing, and structure-based traders seeking a coherent framework to analyze market direction and structure without relying on reactive signals. It offers real-time UI controls for mode switching and label adjustments, supporting informed decision-making based on market structure rather than immediate price action.
Customer reviews
5 | 75 % | |
4 | 25 % | |
3 | 0 % | |
2 | 0 % | |
1 | 0 % |
Discussion
FAQ









!["[Hamster-Coder] Bollinger Bands" logo](https://cdn.ctrader.com/image/webp/21d8e5d6-fb11-4bac-b9ee-cd05c2b76804_30327)






!["[Stellar Strategies] MARSI Signal Plotter" logo](https://cdn.ctrader.com/image/webp/7b2b8da6-8f8e-4646-8d4a-4710c516c01e_25567)






Price