
Volume Meter
Indicator
2 purchases
Version 1.0, Sep 2025
Windows, Mac
5.0
Reviews: 1
Description
📘 What This Indicator Does
- It shows tick volume (number of price changes per bar) as a histogram.
- In Forex, brokers rarely provide real traded volume, so tick volume is used as a proxy.
- In stocks/CFDs/futures, you might get real volume.
- It overlays a Moving Average of volume (default 20-period).
- This acts as a “baseline” to quickly spot whether the current bar’s volume is unusually high or low.
🎯 How to Use as Confirmation
The indicator is not a standalone signal generator. Instead, traders use it to confirm setups from other strategies:
- Breakout Confirmation
- If price breaks above resistance or below support, check if the breakout candle has volume above its MA.
- High volume confirms more participants are behind the move → breakout is more reliable.
- Low volume breakout = higher chance of false breakout.
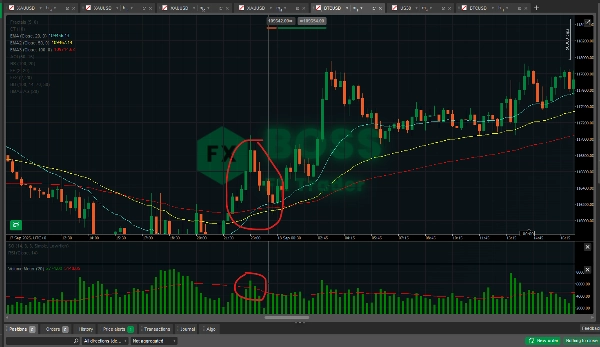
- Trend Continuation vs. Exhaustion
- In a strong trend, pullback candles often have lower volume compared to impulse candles.
- If a pullback happens on low volume and the next move resumes with higher volume → confirms trend continuation.
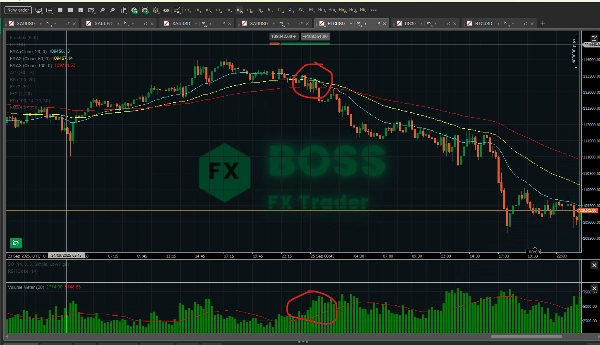
- If you see the trend push continuing but volume dropping each push → possible exhaustion, prepare for reversal.
- Reversal Confirmation
- Big reversal candles (pin bars, engulfing candles, fractals) are stronger if backed by a volume spike.
- Example: bullish pin bar at support with high volume = stronger reversal signal than same pin bar on low volume.
- False Signal Filter
- If your main system gives a buy/sell, but volume is weak (below average), you might choose to pass on that trade.
- Helps reduce overtrading and filter noise.
📊 Effectiveness
- In Forex: Tick volume has been shown to correlate strongly with real traded volume (70–90% correlation in many studies). So it’s useful, but not perfect.
- In Stocks/Futures/CFDs: Real volume makes this much more powerful since you’re measuring actual traded contracts/shares.
- As Confirmation: It’s best used with price action and other indicators (e.g., EMA, RSI, fractals). Relying on volume alone is risky.
- Strengths: Confirms breakouts, filters false moves, spots exhaustion.
- Weaknesses: Does not predict direction by itself — only adds confidence once you have a setup.
✅ Practical tip:
Use the indicator as a filter, not a trigger. For example:
- You see an EMA crossover (buy signal).
- Check: Is volume above its moving average? If yes → take trade. If not → wait.
This way you only trade when momentum is backed by market participation.
Summary
AI summary
Volume Meter is a trading indicator that displays tick volume—the number of price changes per bar—as a histogram. In Forex markets, where real traded volume data is often unavailable, tick volume serves as a proxy, while in stocks, CFDs, and futures, real volume data may be used. The indicator overlays a moving average of volume (default 20-period) to provide a baseline, helping traders identify whether current volume is unusually high or low.
This tool is designed to confirm trading setups rather than generate standalone signals. It assists in validating breakouts by checking if breakout candles have volume above their moving average, indicating stronger market participation. It also helps distinguish trend continuation from exhaustion by comparing volume levels during pullbacks and impulse moves. Additionally, it supports reversal confirmation by highlighting volume spikes on significant reversal candles and filters false signals by advising caution when volume is weak despite buy or sell signals from other systems.
Volume Meter is applicable across various markets including Forex, stocks, indices, commodities, and cryptocurrencies. Its effectiveness is enhanced when combined with price action and other indicators such as EMA or RSI. The indicator aids in improving trade decision confidence by integrating volume analysis as a confirmation and filtering tool.
Indicator profile
Customer reviews
5.0
Reviews: 1
5 | 100 % | |
4 | 0 % | |
3 | 0 % | |
2 | 0 % | |
1 | 0 % |
Customer reviews
October 1, 2025
the first 10 trades should stay boring, and the checklist becomes easier to follow.
Discussion
FAQ
BTCUSD
Forex
Breakout
Indices
EURUSD
Commodities
GBPUSD
NZDUSD
Prop
Supertrend
Crypto
Stocks
XAUUSD
NAS100
USDJPY
Products available through cTrader Store, including trading bots, indicators and plugins, are provided by third-party developers and made available for informational and technical access purposes only. cTrader Store is not a broker and does not provide investment advice, personal recommendations or any guarantee of future performance.


Price
Since 29/05/2025
3.04M
Traded volume
45.22K
Pips won
29
Sales
768
Free installs