Brokers & props
For business
00
Days
:
00
Hours
:
00
Minutes
:
00
Seconds
Indicator
NAS100
NZDUSD
XAUUSD
Stocks
Forex
EURUSD
GBPUSD
Crypto
BTCUSD
USDJPY
Bayesian Price Projection Model
03/10/2025
125
Desktop
Since 03/10/2024
Sales
123
Free installs
24106
"Bayesian Price Projection Model" uploaded image"Bayesian Price Projection Model" uploaded image"Bayesian Price Projection Model" uploaded image"Bayesian Price Projection Model" uploaded image

🚀 10,000+ traders already use our TOP indicators🏆

Discover why professionals choose us – the most powerful tools on cTrader (indicators, algorithms, and cBots) are waiting for you.

👉 Get all our TOP systems here:

_______________________________________________

📌 Market Structure Indicators

·     ✅ AdvancedMarket Structure: Bos, Choch, SwinLevels, Order Blocks,  Market Structure& Liquidity Finder

·     🔄 Dynamic Market StructureAnalysis of Turning Points

·     🧱 Order Block

·     ⚖️ Market Imbalance

·     ⛓️ BOS & CHOCH

·     🧠 ICT Power of 3

·     🌀 Market Polarity Zones

_______________________________________________

🔚 Smart Exit Systems

·     📍 Trailing Smart Algorithm

_______________________________________________

📐 ZigZag Indicators

·     🔍 ZigZag Price LiquidityProjection

·     🧭 S&R Structural ZigZag

·     ➖ ZigZag

·     🎯 Zig-Zag Extremity Tracker

_______________________________________________

🧱 Support & Resistance Indicators

·     🟩 SmartTrend Support &Resistance Lines

·     🧱 All Support and ResistanceLevels

_______________________________________________

📊 Trend & Channel Indicators

·     🔄 Auto-Trend Channel

·     📊 Supertrend

·     ⚡Momentum Trend Analyzer

·     🧠 Adaptive Trend Channel

·     💥 Channel Breakout System

·     🌈 Dynamic Trend Gradient

·     ⭐ PREMIUM SSL CHANNEL

·     🔁 Reactive Moving Average

_______________________________________________

💧 Volume & Liquidity Tools

·     🔥 Volume POC Heatmap

·     📉 Leverage Liquidation Map

·     🔍 Momentum Fair Value Gap

·     🕒 Fair Value Gap Sessions

_______________________________________________

Momentum & RSI Indicators

·     📈 RSI Trend Trigger

·     🚀 Dynamic Range Momentum

·     🔎 Multi-Level Candle Bias
Tracker

_______________________________________________

🔮 Prediction & Projection Tools

·     📐 Prediction Based on Linreg& ATR

·     📏 Fibonacci Linear RegressionMulti-timeframe

·     📈 Volume-Powered Market Flow Projector

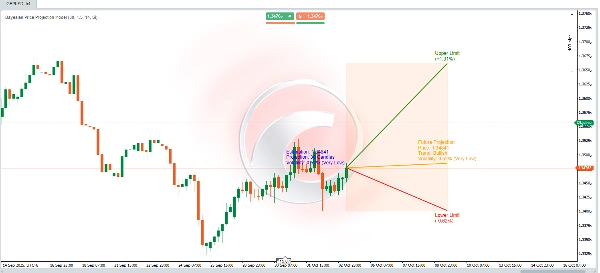
📊 Dynamic Price Projection Algorithm 📈

This algorithm combines **statistical calculations**, **technical analysis**, and **Bayesian theory** to forecast a future price while providing **uncertainty ranges** that represent upper and lower bounds. The calculations are designed to adjust projections by considering market **trends**, **volatility**, and the historical probabilities of reaching new highs or lows.

Here’s how it works:

🚀 Future Price Projection
A dynamic calculation estimates the future price based on three key elements:
1. **Trend**: Defines whether the market is predisposed to move up or down.
2. **Volatility**: Quantifies the magnitude of the expected change based on historical fluctuations.


🧠 **Bayesian Probabilistic Adjustment**
- Conditional probabilities are calculated using **Bayes' formula**:
\[
P(A|B) = \frac{P(B|A) \cdot P(A)}{P(B)}
\]
This models future events using conditional information:
- **Probability of reaching a new all-time high** if the price is trending upward.
- **Probability of reaching a new all-time low** if the price is trending downward.

- These probabilities refine the future price estimate by considering:
- **Higher volatility** increases the likelihood of hitting extreme levels (highs/lows).
- **Market trends** influence the expected price movement direction.


🌟 **Volatility Calculation**
- Volatility is measured using the **ATR (Average True Range)** indicator with a 14-period window. This reflects the average amplitude of price fluctuations.
- To express volatility as a percentage, the ATR is normalized by dividing it by the closing price and multiplying it by 200.
- Volatility is then categorized into descriptive levels (e.g., **Very Low**, **Low**, **Moderate**, etc.) for better interpretation.

---

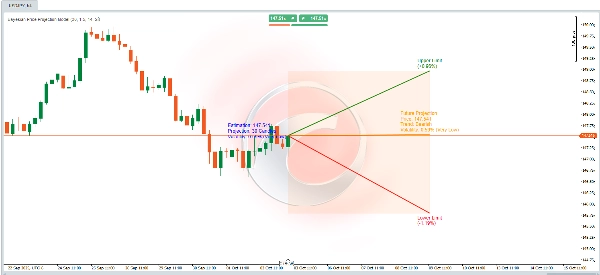
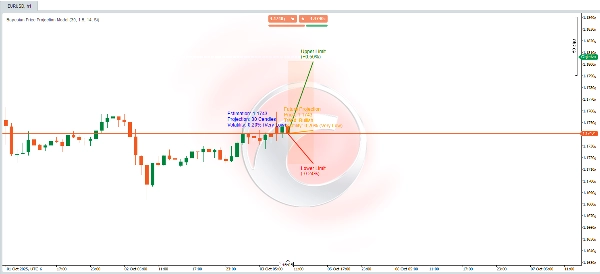
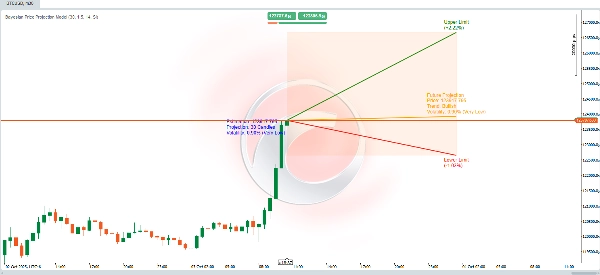
🎯 **Deviation Limits (Upper and Lower)**
- The upper and lower limits form a **projected range** around the estimated future price, providing a framework for uncertainty.
- These limits are calculated by adjusting the ATR using:
- A user-defined **multiplier** (`factor_desviacion`).
- **Bayesian probabilities** calculated earlier.
- The **square root of the projected period** (`proyeccion_dias`), incorporating the principle that uncertainty grows over time.


🔍 **Interpreting the Model**
This can be seen as a **dynamic probabilistic model** that:
- Combines **technical analysis** (trends and ATR).
- Refines probabilities using **Bayesian theory**.
- Provides a **visual projection range** to help you understand potential future price movements and associated uncertainties.

⚡ Whether you're analyzing **volatile markets** or confirming **bullish/bearish scenarios**, this tool equips you with a robust, data-driven approach! 🚀

0.0
Reviews: 0
Customer reviews
No reviews for this product yet. Already tried it? Be the first to tell others!
More from this author
Indicator
RSI
Breakout
XAUUSD
+6
ZigZag
ZigZag filters noise, spots trends, patterns, pivots, aiding analysis, trade management, and confirmations. 📉📈
Indicator
RSI
Breakout
XAUUSD
+6
Order Block
Identify bullish and bearish Order Blocks to spot key support/resistance levels and potential trend reversals! 📈🔄
Indicator
RSI
Breakout
XAUUSD
+5
Auto-Trend Channel
Adaptive trend channel using linear regression and Pearson correlation for dynamic support, resistance, and trends.
Indicator
RSI
XAUUSD
Breakout
+5
BOS & CHOCH
Market structural patterns , specifically the concepts of Change of Character (ChoCH) 🔄 and Break of Structure (BoS) 💥
Indicator
RSI
Breakout
XAUUSD
+6
Volume POC Heatmap
📊 Shows volume by price levels, highlights POC, and key zones. Identifies dynamic support/resistance and imbalances.
Indicator
RSI
Breakout
Supertrend
All Support and Resistance Levels
"Identify key market zones and visualize support/resistance from multiple timeframes on a single chart.
Indicator
RSI
Breakout
XAUUSD
+5
Zones Supply Demand
📊Zones Supply & Demand: Identifies key price levels with high volume concentration, marking Supply/Demand Zones & Marke
Indicator
RSI
Breakout
XAUUSD
+5
Supertrend
💹 Define a price channel 📈 and determine trend direction (bullish 🟢 or bearish 🔴).
Indicator
RSI
Breakout
XAUUSD
+6
Fair Value Gap Sessions
identify and highlight temporary market inefficiencies known as "fair value gaps" 🚨 within specific trading Sessions.
Indicator
RSI
Breakout
XAUUSD
+4
Dynamic Market Structure Analysis of Turning Points
Identify market structure effortlessly with swing highs, lows, CHoCH, and BOS levels for smart trading decisions! 📊🔍"
Indicator
Indices
RSI
XAUUSD
+7
RSI Divergence
Detects bullish and bearish divergences
Indicator
RSI
Breakout
Supertrend
Trend Heikin Multi MA
🚀 TrendHeikinMultiMA: Advanced trend detection using Heikin-Ashi smoothing & MAs! Eliminates noise, confirms real trend
Indicator
RSI
Breakout
XAUUSD
+4
Multi-Level Candle Bias Tracker
Price direction by calculating the probability of reaching new highs/lows. Shows levels & stats📈
Advanced Market Structure Bos,Choch,SwinLevels, Order Blog
Advanced price action tool that combines multiple technical analysis concepts
Indicator
RSI
Breakout
Supertrend
Swing Levels
🔍 Automatically detect support and resistance levels based on "swings" or pivots
Indicator
RSI
Breakout
Supertrend
Leverage Liquidation Map
📊 Liquidation Map: Potential areas where highly leveraged investors might face liquidations.
Indicator
RSI
Breakout
Supertrend
Market Trend OB
Price action to detect when the market changes trend (MSB) and defines, order blocks , ZigZag etc.📊
Indicator
RSI
Breakout
Supertrend
Zig-Zag Extremity Tracker
Dynamically adjusts regression channels based on ZigZag extremes, resetting when price breaks bands to track real trends
You may also like
Indicator
NZDUSD
XAUUSD
Commodities
+3
AlgoCorner Correlations Map
Check the correlations between dozens of assets in one elegant display.
IR Multi Data
show symbol and time fram, daily net profit percent, daily net profit, and spread ln your chart. consider that timezone
IR CheckList
you could put your check list in your chart you could split your test with “,” you could put your checklist in indicat
Indicator
Indices
MFI-MTF
MFI- MTF is a multi-timeframe momentum indicator that brings higher timeframe perspective to your current chart
Indicator
NAS100
NZDUSD
Breakout
+13
SupportResistance
Auto-detect support and resistance & trendlines, highlight pullbacks/BOS retests, and filter with candle confirmation.
Indicator
NAS100
NZDUSD
XAUUSD
+11
ADXVMA Aurora Trend Filter
⚡ ADXVMA Aurora Trend Filter combines ADX trend strength with an adaptive EMA blend ⚡
SpreadCalculator - BossFXTrader
Spread Calculator to calculate the difference between two prices or values.
Indicator
Indices
Breakout
Forex
+2
Time zone pro
FREE Global Trading Sessions Indicator
Indicator
NAS100
XAUUSD
Commodities
+11
SCOB
SCOB - Single Candle Order Block Indicator
BLOCK LIQUIDITY PRO
Block Liquidity,indicator.Block Order, Liquids Stops, Signal Sentiment,signal correctio.
Indicator
Indices
Prop
XAUUSD
+8
FREE Squeeze Momentum from TradingView
Squeeze Momentum - Anticipate explosive market moves before they happen
Fisher_m11
Fisher Transform with smoothing. Spot reversals and cycles with precision. Great for any market, any timeframe.
VegaXLR - RSI and StochRSI Alerts
VegaXLR's cTrader StochRSI identifies overbought/oversold RSI levels for precise trade entries.
Order Flow Ticks v2.0
Indicator
Forex
Crypto
VegaXLR - Bar Close Alert Manager
Bar Close Alert Manager provides real-time alerts for bar closures with customizable notifications and automation.
Indicator
XAUUSD
Forex
EURUSD
+2
FX Market Sessions
Visualize trading sessions with high/low levels, customizable colors, and live open session display
Morning Star On Chart
Morning Star pattern on chart (Bullish and Bearish) automatically marked with (BUY & SELL) Very powerful signals.