Description
🚀 10,000+ traders already use our TOP indicators 🏆 …and the community keeps growing!
Discover why professionals choose us – cTrader’s most powerful tools (indicators + algorithms + cBots) are waiting for you.
👉 Get all our TOP systems here:
Pinescriptlabs Store indicators: Pinescriptlabs Store cBots : (cBot) Gold & BTC BreakoutSession Pivots(new)
Advanced Market Structure: Bos, Choch, SwinLevels, Order Blocks, Market Structure & Liquidity Finder (New)
ZigZag Price Liquidity Projection
Trailing Smart Algorithm (new)
Prediction Based on Linreg & ATR
SmartTrend Support &
Resistance
Lines
Dynamic
Market Structure
Analysis
of
Turning
Points
Fibonacci
Linear
Regression
Multi-timeframe
Auto
Support and
Resistance
Trend
Lines
All
Support and
Resistance
Levels
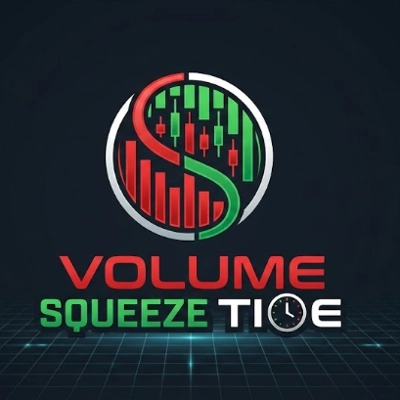
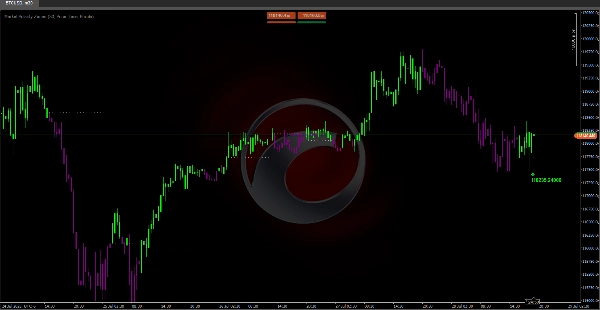
Market Polarity Zones 📊
What does this algorithm do?
Market Polarity Zones is an advanced indicator that simplifies market analysis by automatically identifying bullish 🚀 or bearish 🐻 phases and marking key levels where trend reversals are likely.
Ideal for:
- Price action traders
- Swing traders
- Scalpers,...who need to quickly spot market direction and precise entry/exit points.
How does the logic work?
The algorithm uses two Hull Moving Averages (HMA) with different periods to detect momentum shifts and sets dynamic levels as follows:
- Detects HMA crossovers to identify trend changes.
- Sets automatic levels:
- Bullish crossover → Marks the low as support level
- Bearish crossover → Marks the high as resistance level
- Keeps the active level until a new crossover occurs.
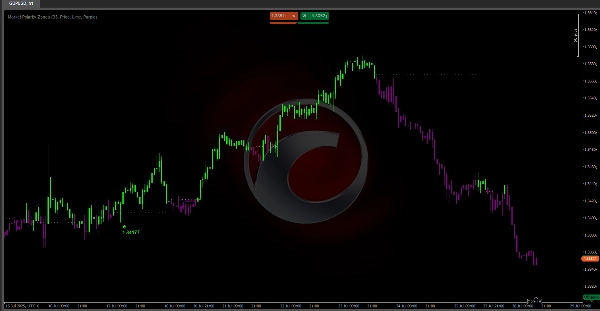
What you’ll see on your chart:
🎨 Intuitive color system:
- Green candles 🟢: Price above the level (bullish zone – look for buys)
- Purple candles 🟣: Price below the level (bearish zone – look for sells)
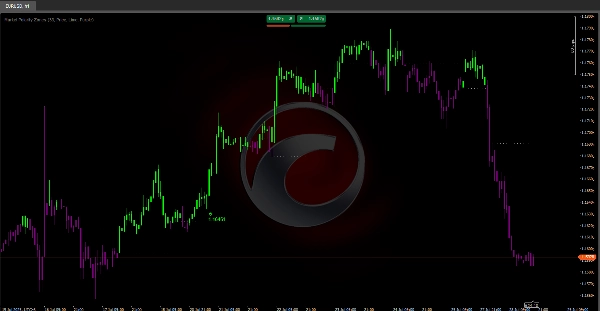
📉 Dynamic level lines:
- Dotted horizontal lines marking the active polarity level
- Automatically extend while the level remains valid
- Only appear when the level stabilizes
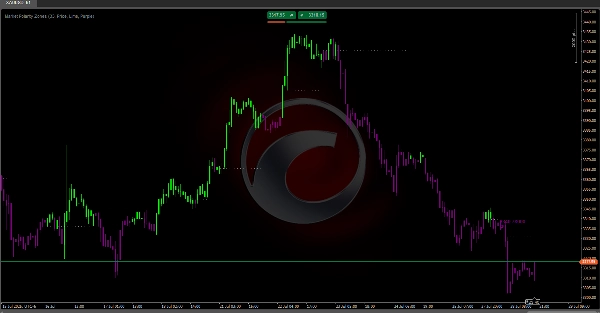
⚠️ Reversal alerts:
Arrow labels appear when specific patterns form:
- 🔻 Bearish Reversal (purple label):
- Pattern: Price rises → fails → drops below the level
- Meaning: Bullish pressure weakening, possible shift to bearish zone
- 🔺 Bullish Reversal (green label):
- Pattern: Price drops → bounces → rises above the level
- Meaning: Buyers defending the level, possible shift to bullish zone
ℹ️ Label information:
- "Price": Shows the exact breakout failure point – use it for precise stops or identifying key resistance/support.
- "Volume": Sum of the last 3 bars’ volume – confirms if the reversal has real market participation.
Recommended settings:
- Length: 33 (default) – Works well for most markets
- Label Data: "Price" for level precision, "Volume" for confirmation
- Colors: Keep Lime/Purple for best visual contrast 🎨