
Auto Support and Resistance Trend Lines
Indicator
Version 1.0, Feb 2025
Windows, Mac
Since 03/10/2024
177
Sales
45.33K
Free installs
Description
Summary
AI summary
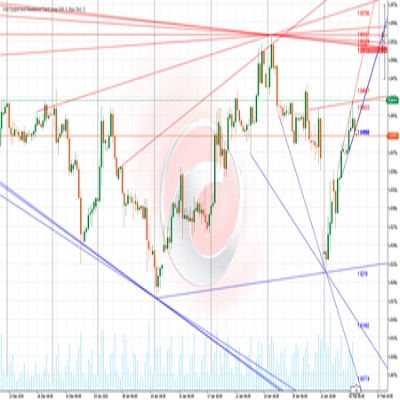
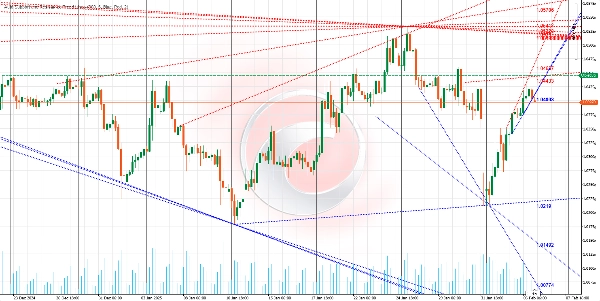
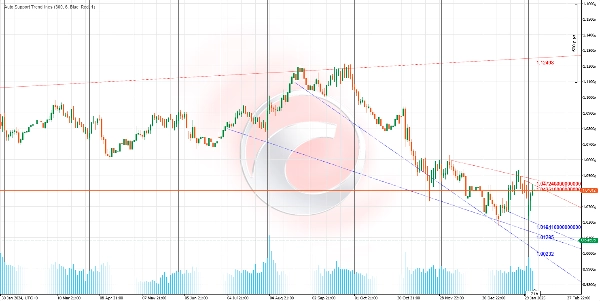
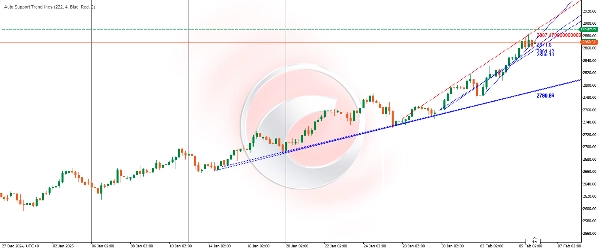
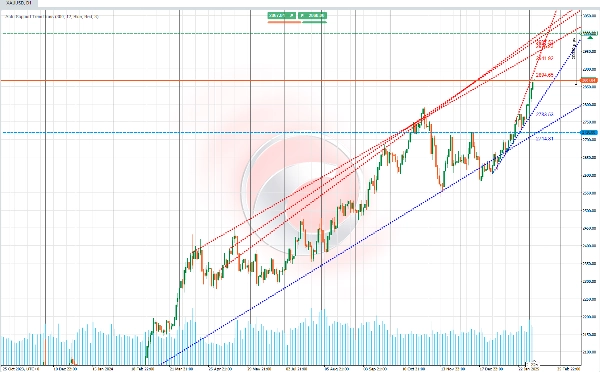
Auto Support and Resistance Trend Lines is an indicator that automatically identifies and draws key support and resistance levels on price charts. It detects both horizontal lines and diagonal channels that represent market trends, highlighting areas where price has historically struggled to move higher (resistance) or lower (support).
The algorithm analyzes price history by identifying local lows and highs within a specified range of bars. It validates these levels by checking if the price has respected them multiple times in the past. Validated support and resistance levels are drawn as horizontal or diagonal lines. Additionally, the indicator connects these levels to form diagonal channels that indicate bullish or bearish trends.
The indicator updates dynamically with each new bar, recalculating and redrawing levels based on the latest price action. Traders can customize parameters such as the number of bars analyzed, line thickness, and colors to suit different trading styles and visual preferences.
This tool aids traders by providing a macro view of market trends, identifying critical support and resistance zones useful for setting entry and exit points, stop-loss and take-profit orders, and spotting potential breakouts or reversals. It automates technical analysis, saving time and helping traders make more informed decisions.
The algorithm analyzes price history by identifying local lows and highs within a specified range of bars. It validates these levels by checking if the price has respected them multiple times in the past. Validated support and resistance levels are drawn as horizontal or diagonal lines. Additionally, the indicator connects these levels to form diagonal channels that indicate bullish or bearish trends.
The indicator updates dynamically with each new bar, recalculating and redrawing levels based on the latest price action. Traders can customize parameters such as the number of bars analyzed, line thickness, and colors to suit different trading styles and visual preferences.
This tool aids traders by providing a macro view of market trends, identifying critical support and resistance zones useful for setting entry and exit points, stop-loss and take-profit orders, and spotting potential breakouts or reversals. It automates technical analysis, saving time and helping traders make more informed decisions.
Indicator profile
Discussion
Customer reviews
0.0
Reviews: 0
Customer reviews
No reviews for this product yet. Already tried it? Be the first to tell others!
FAQ
Supertrend
RSI
Products available through cTrader Store, including trading bots, indicators and plugins, are provided by third-party developers and made available for informational and technical access purposes only. cTrader Store is not a broker and does not provide investment advice, personal recommendations or any guarantee of future performance.






























Price
Since 03/10/2024
177
Sales
45.33K
Free installs