
VegaXLR - Fibonacci Bands
Indicator
2 purchases
Version 1.0, Feb 2025
Windows, Mac
5.0
Reviews: 2
Description
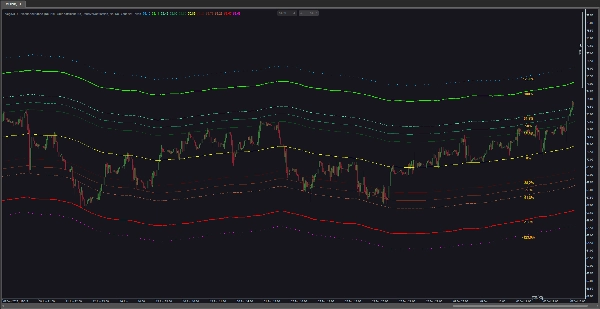
If you're looking for a dynamic Fibonacci channel indicator for cTrader, look no further. This indicator automatically draws Fibonacci bands parallel to a moving average of your choice. It's user-friendly and, like my other indicators, provides alerts through Pop-up, Sound, Email, and Telegram messages. Plus, you have the flexibility to customize the Bands, Fibonacci levels, and Alerts.
Here's a list of its features:
- Fibonacci Bands Calculation: The indicator calculates and plots Fibonacci bands based on your selected moving average. These bands stem from Fibonacci levels (e.g., 0.0%, 38.2%, 61.8%, or any others) and extend above and below the moving average by a specified factor.
- Moving Average Configuration: Customize the moving average type (e.g., Simple, Exponential, etc.) and the number of periods used in the calculation. The moving average serves as the foundation for the Fibonacci bands.
- Alert Functionality: The indicator offers various alert options to notify traders about specific events. This includes price level touch alerts and proximity alerts.
- Price Level Touch Alerts: Configure the indicator to trigger alerts when the price touches specific Fibonacci levels. Alerts can be based on the closing price or immediately when the price touches the level.
- Proximity Alerts: Set up proximity alerts to receive notifications when the price approaches or moves away from a specified Fibonacci level within a defined distance. Alerts can trigger when the price is approaching or distancing from the level.
- Alert Output Options: Choose from sound alerts, pop-ups, Telegram messages, and email notifications for alerts. Sound alerts can be customized by selecting different sound files.
- Visualization Options: Customize the visualization of Fibonacci levels with options such as displaying percentage values, setting color for percentage labels, controlling label location on the chart, enabling/disabling specific bands, and choosing color, thickness, and appearance of the bands.
- Configurable Fibonacci Levels: Tailor the indicator to your trading strategy by adjusting the specific Fibonacci levels used in the calculation. Positive and negative Fibonacci levels can be customized individually.
- Built-in User Guide: You can access the user guide for this indicator directly from the chart.
In summary, the VegaXLR - Fibonacci Bands indicator combines Fibonacci analysis and moving averages to help identify potential support and resistance levels. With configurable alert functionality and visualization options, it's an invaluable tool for traders who rely on Fibonacci retracements or expansions.
Summary
AI summary
VegaXLR - Fibonacci Bands is a dynamic indicator for cTrader that automatically plots customizable Fibonacci bands parallel to a user-selected moving average. Traders can configure the moving average type (e.g., Simple, Exponential) and periods, which serve as the basis for the Fibonacci bands derived from adjustable Fibonacci levels (such as 0.0%, 38.2%, 61.8%, and others). The indicator supports both positive and negative Fibonacci levels, allowing tailored analysis.
It features multiple alert options including price level touch alerts—triggered on price contact or close at specified Fibonacci levels—and proximity alerts that notify when price approaches or moves away from these levels within a defined range. Alerts can be delivered via pop-up, sound (with customizable sounds), email, and Telegram messages.
Visualization settings enable customization of band colors, thickness, label display and position, and selective enabling or disabling of bands. A built-in user guide is accessible directly from the chart for ease of use.
Overall, VegaXLR - Fibonacci Bands combines Fibonacci retracement and expansion analysis with moving averages to assist traders in identifying potential support and resistance zones, enhanced by configurable alerts and visualization options.
Indicator profile
Customer reviews
5.0
Reviews: 2
5 | 100 % | |
4 | 0 % | |
3 | 0 % | |
2 | 0 % | |
1 | 0 % |
Customer reviews
February 23, 2025
the setup gets a moment before execution, but a real person still needs review the setup.
February 19, 2025
Discussion
FAQ
Forex
Products available through cTrader Store, including trading bots, indicators and plugins, are provided by third-party developers and made available for informational and technical access purposes only. cTrader Store is not a broker and does not provide investment advice, personal recommendations or any guarantee of future performance.


!["[Stellar Strategies] MARSI Signal Plotter" logo](https://cdn.ctrader.com/image/webp/7b2b8da6-8f8e-4646-8d4a-4710c516c01e_25567)


Price
232
Sales
695
Free installs