
Description
Hull Moving Average Colored – Trend Direction at a Glance
Overview
Hull Moving Average Colored is a streamlined trend-following indicator that applies the responsiveness of the Hull Moving Average with color-coded directional signals. By displaying uptrends in green and downtrends in red, it provides instant visual confirmation of momentum direction without requiring complex analysis.
What It Does
Hull Moving Average Foundation: The indicator uses the Hull Moving Average (HMA), a fast-reacting moving average designed to reduce lag while maintaining smoothness. Unlike traditional moving averages, the HMA prioritizes recent price action, making it particularly useful for catching trend changes early.
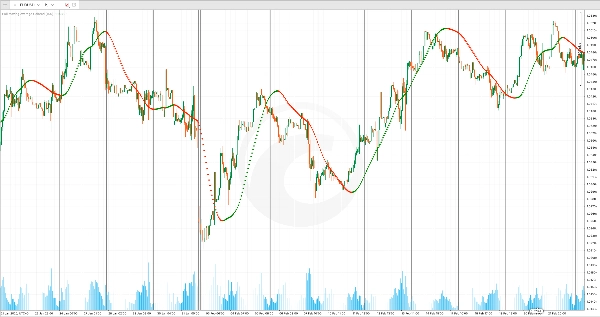
Color-Coded Trend Visualization: Instead of a single line, the indicator plots directional points:
- Green Points: Appear when the HMA is rising, indicating upward momentum
- Red Points: Appear when the HMA is falling, indicating downward momentum
This binary color system makes trend direction unmistakable at a glance—no need to interpret slope or compare to previous bars.
Key Features
Overlay Display: The indicator plots directly on your price chart, allowing you to see trend direction in relation to actual price levels. This makes it easy to spot when price breaks above or below the moving average, signaling potential entry and exit points.
Responsive Lag Reduction: The Hull Moving Average reacts faster than standard exponential or simple moving averages, making it particularly effective for swing traders and intraday traders who need timely signals without excessive whipsaws.
Simple Customization: Adjust the Period parameter to control sensitivity. Shorter periods (e.g., 20-32) make the indicator more responsive to recent moves but prone to false signals in choppy markets. Longer periods (e.g., 64-128) provide smoother trends with fewer false breakouts but may miss quick reversals.
Practical Use
Use Hull Moving Average Colored as a quick filter for trade direction. Only take long trades when green points are appearing and price is above the average; only take short trades when red points are appearing and price is below the average. Conversely, treat color changes as potential exit signals—when green switches to red, it's time to reassess your long positions.
The indicator works well in trending markets and is especially useful on higher timeframes (4-hour and daily) where it can help you align with the broader directional bias before trading lower timeframe setups.
Summary
This indicator overlays directly on price charts and uses a binary color system to indicate trend direction: green points appear when the HMA is rising, signaling upward momentum, and red points appear when the HMA is falling, signaling downward momentum. This visual approach allows traders to quickly identify trend direction without interpreting slopes or comparing previous bars.
Users can adjust the period parameter to control sensitivity—shorter periods increase responsiveness but may generate more false signals, while longer periods smooth trends but may delay signals. The indicator is suitable for various markets including Forex, indices, stocks, and cryptocurrencies such as BTCUSD and XAUUSD. It is particularly useful on higher timeframes (4-hour and daily) for aligning with broader market trends and can assist in identifying potential entry and exit points based on trend changes.
Customer reviews
5 | 0 % | |
4 | 100 % | |
3 | 0 % | |
2 | 0 % | |
1 | 0 % |


