
Description
Quantitative Qualitative Estimation (QQE) Multi-Timeframe Indicator
The Quantitative Qualitative Estimation (QQE) indicator is a technical analysis tool that enhances the Relative Strength Index (RSI) by incorporating smoothed moving averages. It helps traders assess trend strength, potential reversals, and overbought/oversold conditions with greater accuracy.
QQE features two key components: the fast and slow trailing stop levels, which act as dynamic support and resistance. This makes it a versatile tool for both trend-following and mean-reversion strategies. A crossover between the QQE line and its signal line often indicates potential buy or sell opportunities.
Multi-Timeframe QQE: An Advanced Version
This enhanced version of the QQE indicator is designed as a multi-timeframe tool, integrating both fast and slow trend lines for improved precision. By analyzing price action across multiple timeframes, it provides a comprehensive view of market trends.
Its advanced smoothing algorithm enhances its reliability, making it an effective standalone indicator for:
✅ Identifying trend direction
✅ Generating precise entry and exit signals
✅ Detecting overbought and oversold conditions
The flexibility of the Multi-Timeframe QQE makes it suitable for both trend-following and reversal strategies.
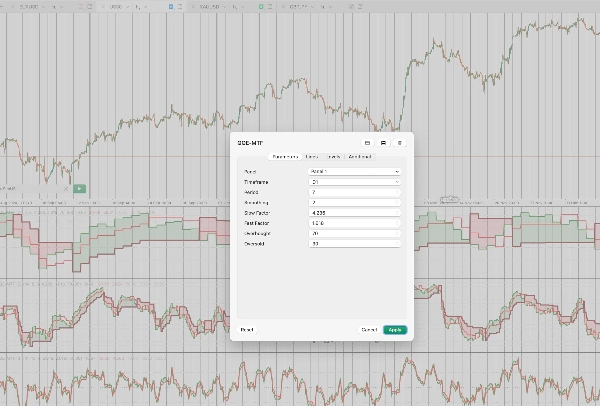
How to Use the Multi-Timeframe QQE
To configure the Multi-Timeframe QQE, traders must select:
🔹 A timeframe (e.g., Daily, H4, H1)
🔹 Periods (number of candles used in the calculation)
🔹 A smoothing period (for RSI smoothing)
🔹 Slow and fast factors (to adjust sensitivity)
🔹 Customizable overbought and oversold levels
📌 Note: Since this is a multi-timeframe indicator, after adding it to the chart, it is essential to zoom out in the cTrader interface to allow sufficient data to load and properly initialize the indicator.
Trading Strategies with Multi-Timeframe QQE
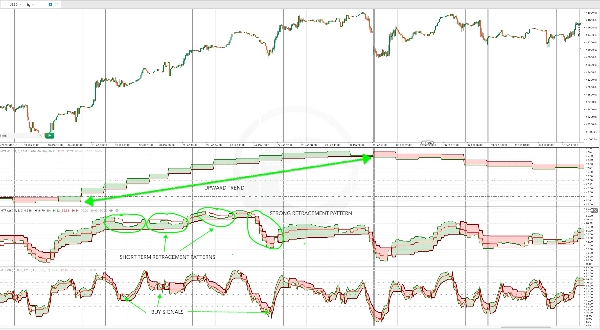
1️⃣ QQE for High Timeframe Trend Confirmation
One effective way to use the Multi-Timeframe QQE is for trend confirmation on a higher timeframe while identifying retracement entries on a lower timeframe.
For example:
- The QQE on the daily timeframe is used to confirm a strong trend.
- Retracement entries are then identified when the Stochastic Oscillator crosses the overbought or oversold levels.
This method helps traders align their entries with the overall trend.
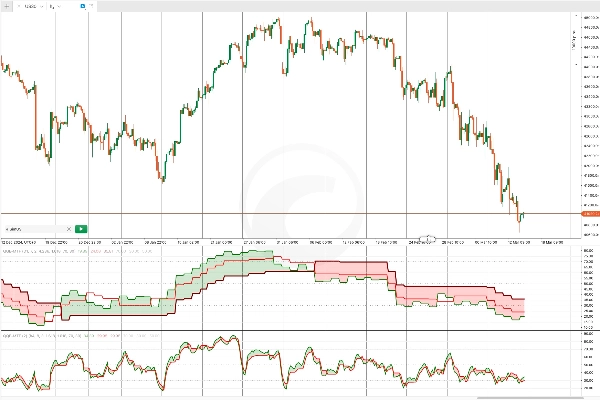
2️⃣ Multi-Timeframe Analysis for Deeper Market Insights
Using the QQE across multiple timeframes allows traders to gain a more detailed understanding of an asset’s behavior.
For instance, by applying the QQE on:
📊 Daily timeframe (D1): Determines the overall trend direction.
📊 4-hour timeframe (H4): Confirms trend direction and identifies short-term pullbacks.
📊 1-hour timeframe (H1): Generates precise entry signals based on overbought/oversold conditions or countertrend moves.
This structured approach enhances trade timing and decision-making by aligning signals across different timeframes.
Summary
This advanced multi-timeframe tool integrates fast and slow trend lines to analyze price action across different timeframes, providing a comprehensive view of market trends. Its smoothing algorithm improves reliability, making it effective for identifying trend direction, generating precise entry and exit signals, and detecting overbought/oversold levels.
Users configure the indicator by selecting a timeframe (e.g., Daily, H4, H1), periods for calculation, smoothing period for RSI, sensitivity factors, and customizable overbought/oversold thresholds. It is recommended to zoom out in the cTrader interface after adding the indicator to allow sufficient data loading.
Typical strategies include using the QQE on higher timeframes for trend confirmation and on lower timeframes for entry timing, as well as multi-timeframe analysis to enhance trade timing and decision-making by aligning signals across timeframes.
Customer reviews
5 | 50 % | |
4 | 50 % | |
3 | 0 % | |
2 | 0 % | |
1 | 0 % |


