Description
MFI-MTF: Multi-Timeframe Money Flow Index
Overview
MFI- MTF is a multi-timeframe momentum indicator that brings higher timeframe perspective to your current chart. By calculating the Money Flow Index (MFI) on a larger timeframe and displaying it on your working chart, this indicator helps you identify overbought and oversold conditions across multiple market perspectives without manually switching between timeframes.
What It Does
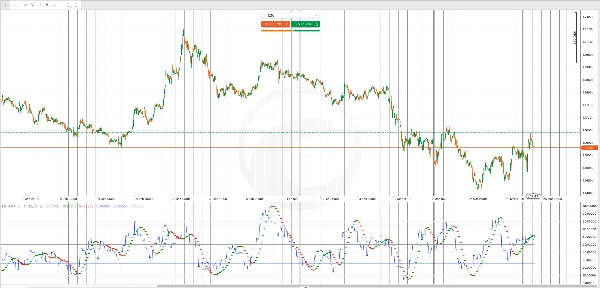
Money Flow Index Analysis: The indicator measures buying and selling pressure by analyzing both price movement and trading volume. It oscillates between 0 and 100, identifying when an asset has experienced excessive buying (overbought) or selling (oversold) pressure.
Higher Timeframe Context: Rather than calculating MFI on your current chart timeframe, MFIMTF pulls data from a larger timeframe you specify (daily, weekly, 4-hour, etc.). This gives you institutional-level momentum insights without the noise of lower timeframes. When the daily MFI shows overbought conditions, for example, you know the larger trend is reaching exhaustion—valuable context for entry and exit decisions.
Hull Moving Average Filter: A Hull Moving Average (HMA) applied to the MFI smooths out whipsaws and highlights directional momentum shifts. Green dots mark uptrends in momentum, while red dots mark downtrends, giving you a quick visual confirmation of momentum direction changes.
Key Outputs
MFI Line (Blue): The main Money Flow Index value from your selected higher timeframe, displayed on every bar of your current chart.
HMA Signals (Green/Red Points): Green points appear when momentum is strengthening upward; red points appear when momentum is weakening or reversing downward. These serve as early warning signals for potential turns.
Reference Levels:
- Overbought Level (default 70): When MFI exceeds this, buying pressure is excessive and reversals become likely
- Oversold Level (default 30): When MFI falls below this, selling pressure is exhausted and bounces become probable
- Middle Line (50): The neutral equilibrium point between bullish and bearish momentum
Customization
Timeframe Selection: Choose any timeframe higher than your current chart (daily on a 1-hour chart, for example). Larger timeframes provide broader trend context but less frequent signals; smaller increments offer more trading opportunities but with less strategic perspective.
MFI Period: Adjust the lookback period for the Money Flow Index (default 14). Shorter periods make the indicator more responsive to recent volume changes; longer periods smooth out volatility and reduce false signals.
HMA Period: Control the smoothing of the momentum filter. Shorter periods make trend changes more obvious but noisier; longer periods confirm trends more reliably but with slower signal generation.
Overbought/Oversold Thresholds: Customize these levels to match your trading style. Conservative traders might use 75/25; aggressive traders might use 80/20 to wait for more extreme conditions.
Practical Use
Use MFI MTF to add confluence to your entries and exits. A sell signal on your working timeframe becomes more reliable if the daily MFI is already overbought, indicating institutional sellers are likely active. Similarly, buy signals gain strength when the higher timeframe MFI is oversold, showing that selling pressure has been exhausted at the macro level.
The HMA color changes give you real-time alerts to momentum shifts, helping you exit losing trades early or reduce position size before reversals become severe.
Summary
The indicator includes a Hull Moving Average (HMA) filter applied to the MFI to smooth out noise and highlight momentum shifts. Green dots indicate strengthening upward momentum, while red dots signal weakening or downward momentum. Reference levels include default overbought (70), oversold (30), and a neutral midpoint (50), all customizable to fit different trading styles.
Key outputs are the MFI line from the chosen higher timeframe and HMA signals for momentum direction changes. Adjustable parameters include the MFI lookback period, HMA smoothing period, and overbought/oversold thresholds. MFI-MTF aids in confirming entry and exit points by providing institutional-level momentum insights and real-time alerts to momentum shifts on your working chart.
Customer reviews
5 | 100 % | |
4 | 0 % | |
3 | 0 % | |
2 | 0 % | |
1 | 0 % |