"Daily Open Pivot Level" logo
Daily Open Pivot Level
0.0
03/09/2025
2
Desktop

#### Features

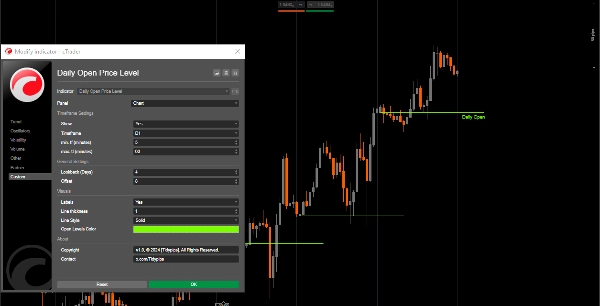
- **Customizable Timeframe**: Users can select a specific timeframe (e.g., daily) to analyze opening levels. Dont set any TF < 1H.

- **Lookback Period**: The indicator supports a lookback period, enabling traders to focus on recent price action and identify relevant points of interest.

- **Dynamic Trendlines**: It draws trendlines to indicate the opening price of the selected timeframe, providing clear visual cues for potential support and resistance levels.

- **Labeling Options**: Traders can enable labels to display the opening price directly on the chart, enhancing clarity and understanding.

- **Visual Customization**: Users can customize line colors, styles, and thicknesses to suit their preferences and improve chart readability.

- **Timeframe Restrictions**: The indicator includes checks to ensure it operates only within specified minimum and maximum timeframe settings, preventing misleading signals.


#### Tutorial

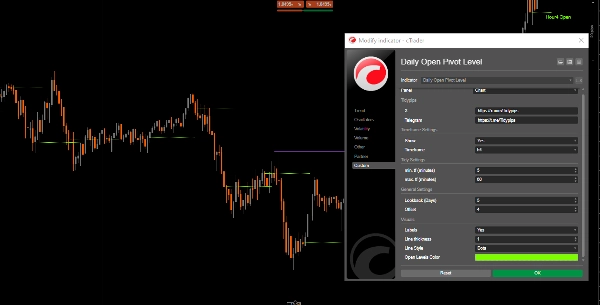
1. **Setup**: Open the indicator settings to select your desired timeframe, lookback period, and customize visual parameters like line color and thickness.

2. **Using the Indicator**: Once applied, the indicator will automatically plot the opening price levels on your chart based on the specified settings.

3. **Analyze**: Observe the plotted levels as you trade. Use these levels to identify potential support and resistance zones, and make informed trading decisions.


#### Recommended Companion Tools

- **cTrader**: The native platform for cAlgo, providing a seamless experience for using and customizing indicators.

- **Technical Analysis Tools**: Combine this indicator with other tools like moving averages or oscillators to enhance your trading strategy and market analysis.

- **Risk Management Tools**: Utilize position size calculators and stop-loss tools to effectively manage risk while trading around the identified opening levels.


By integrating the Daily Open Pivot Level Indicator with these tools, traders can enhance their market analysis and improve their chances of success in navigating the complexities of intraday trading.

More from this author
ICT Killzone and Sessions high_low
This indicator is an essential tool for traders seeking to visualize key trading sessions on their charts.
Indicator
xauusd
commodities
FVG_tidypips
A Fair Value Gap (FVG) indicator that identifies potential price imbalances, potential reversal and continuation zones
Previous Day Liquidity Zones (PDH - PDL)
Useful indicator for traders who want to visualize key price levels based on previous daily highs and lows.
Indicator
commodities
xauusd
True Open Pivot Levels
This indicatorFull Description: Th shows the open price lines at key market times based on Eastern Standard Time (EST).
Moving Average channel
This indicator is designed to display customizable moving averages (MAs) on a chart.
Previous Day Equilibrium (Premium & Discount)
Plots the equilibrium price levels based on previous daily highs and lows.
Drawing Utility
A rectangular box with 5 adjustable Fibonacci level or even custom ones.
You may also like
SmartFibonacci
SmartFibonacci — automatic Fibonacci retracements & extensions with swing detection, alerts and clean labels for cTrader
Flex VWAP
Flexible VWAP indicator with timezone-aware, custom time periods and automatic DST handling.
Indicator
breakout
ORB v1.1
Opening Range Breakout v1.1 - Visuals + Stats
Hull Moving Average Colored
The traditional Hull Moving Average with different colours based on the slope (direction) of the trend.
IR Macd on Chart
this indicator show macd on chart.
Gold Candle 100 Range
Dynamic, color‑coded candles reveal market shifts instantly—spot momentum and trend reversals at a glance
Indicator
bollinger
commodities
rsi
+1
Dot Momentum %BB Indicator
Dynamic circles visualize price's volatility position. Like RSI for market overextension & stretch. Quantify context.
MarketSession-MX
😎Read the description before purchasing💩
Indicator
signal
Hammer Pattern Indicator
TSPivotSMC
Pivot Point MultiTimeFrame with Order Block
High TF Plotter
Captra High TF Plotter visualizes high timeframe Bar on lower timeframe charts, highlighting with bull/bear colors.
FREEE Tradingview Economic Calendar on Chart
Customizable window inside your platform, access to any website Calendar Was Free for early users now -50%
Indicator
forex
indices
eurusd
+1
DXY w HMA
DXY HMA Indicator
VWAP_MTF
📊 VWAP with MTF & Dynamic Deviation Bands
Indicator
signal
FairValueGap-PremiumVersion1
This Fair Value Gap (FVG) indicator is a technical analysis on multi-timeframe.
Indicator
commodities
xauusd
atr
+1
[Stellar Strategies] Visual Trend Momentum
Visual Trend Momentum is a MA/ATR/Volume trend tool. Visual signals for strong trends & reversals. Customizable. 📈📉
Supply Demand V1-Premium
Auto-detect supply & demand zones, remove broken levels, and trade smarter with real-time alerts. Precision made simple.
LDE - Market Sessions
🇫🇷 Visualisez vos sessions de marché et OPR d'un coup d’œil 🇬🇧 Visualize your market sessions & OPR at a glance !