
DayOfWeek - FXMaster
Indicator
3 purchases
Version 1.0, Jul 2025
Windows, Mac
4.0
Reviews: 1
Description
Simplify your chart-reading experience with the Day of Week Indicator—a lightweight visual tool that displays the weekday directly on your charts at the start of each trading day. Designed for traders who appreciate clarity without clutter, this indicator helps you quickly identify daily rhythm and timing for entries, exits, and strategies.
✨ Features
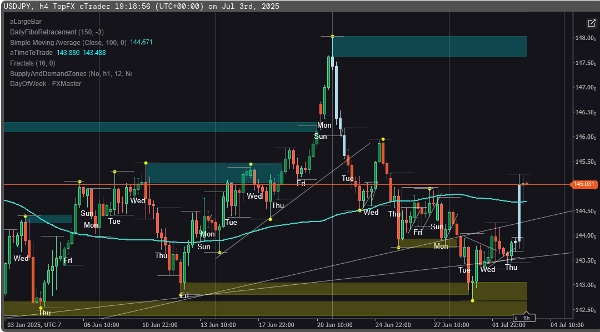
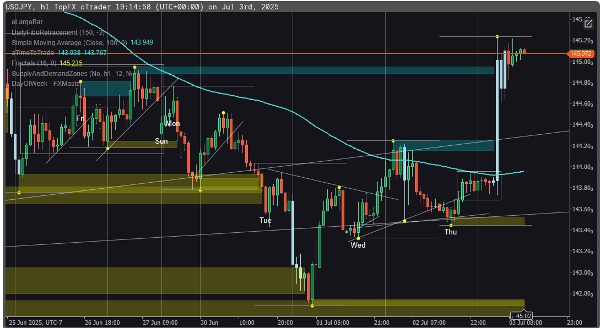
- Displays weekday names: Shows "Mon", "Tue", etc. at the first candle of each new trading day.
- Smart filtering: Labels only the first bar of the day to keep your chart clean and readable.
- Overlay support: Text appears directly on your trading chart for intuitive use.
Summary
AI summary
The Day of Week Indicator for cTrader is a visual tool that displays the weekday name (e.g., "Mon", "Tue") directly on trading charts at the start of each new trading day. It is designed to enhance chart readability by labeling only the first candle of the day, thereby maintaining a clean and uncluttered view. The indicator overlays this information on the chart itself, allowing traders to quickly identify daily timing and rhythm for planning entries, exits, and strategies. It supports multiple markets including Forex, Indices, Commodities, Crypto, and Stocks. This lightweight indicator focuses on clarity and simplicity to assist traders in their daily analysis without adding visual noise.
Indicator profile
Customer reviews
4.0
Reviews: 1
5 | 0 % | |
4 | 100 % | |
3 | 0 % | |
2 | 0 % | |
1 | 0 % |
Discussion
FAQ
Forex
Indices
Commodities
Crypto
Stocks
Products available through cTrader Store, including trading bots, indicators and plugins, are provided by third-party developers and made available for informational and technical access purposes only. cTrader Store is not a broker and does not provide investment advice, personal recommendations or any guarantee of future performance.


Price
Since 11/01/2025
19
Sales