"Session Kill-Zone Highlighter" logo
Indicator
Version 1.0, May 2026
Windows, Mac
5.0
Reviews: 1
"Session Kill-Zone Highlighter" uploaded image
1
Sales
27
Free installs

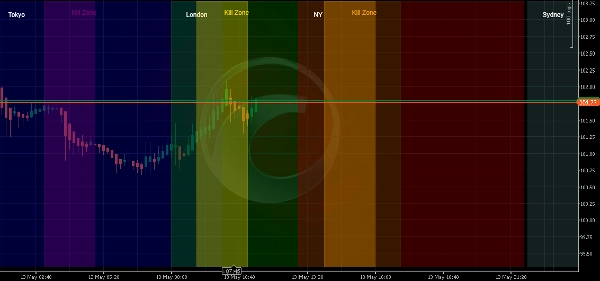
Session & Kill Zone Highlighter is a professional visual indicator designed for traders who follow the ICT/SMC methodology or simply want to know exactly which market session is active at any given time.


🔹 WHAT IT DOES

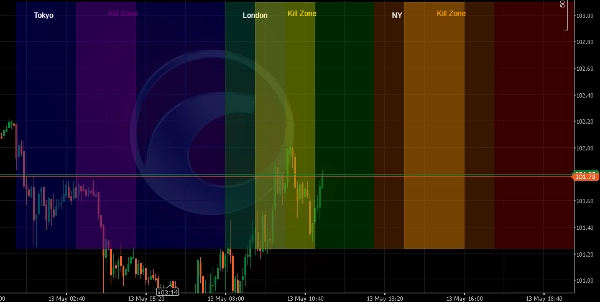
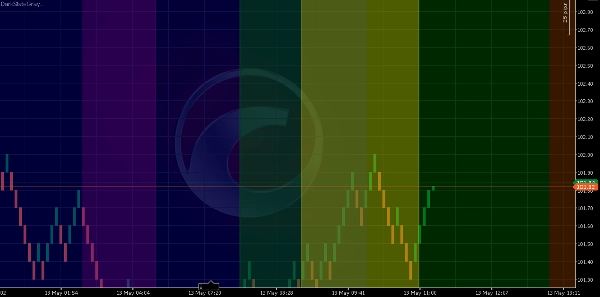
This indicator draws transparent colored rectangles directly on your chart for all major forex sessions:

• Sydney Session (UTC: 22:00 - 07:00)

• Tokyo Session (UTC: 00:00 - 09:00)

• London Session (UTC: 07:00 - 16:00)

• New York Session (UTC: 12:00 - 21:00)


Additionally, it highlights the most liquid ICT Kill Zones:

• Asian Kill Zone (02:00 - 04:00 UTC)

• London Kill Zone (08:00 - 10:00 UTC)

• New York Kill Zone (13:00 - 15:00 UTC)


🔹 KEY FEATURES

✔ Works with ALL chart types: Renko, Candlestick, Line, Tick, Range, Volume, Point & Figure, Kagi

✔ Fully customizable session times and colors

✔ Adjustable opacity for sessions and kill zones (0.1 to 0.9)

✔ Optional session labels and vertical boundary lines

✔ Automatically redraws every day

✔ Handles overnight sessions (e.g., Sydney)


🔹 WHY YOU NEED IT

• Stop guessing which market is active

• Identify the most liquid trading hours at a glance

• Apply ICT methodology with visual confirmation

• Save time – no more manual line drawing

• Works on any timeframe and any instrument (Forex, Indices, Crypto, Commodities, Stocks)


🔹 PRICING & TRIAL

• Regular price: $19 USD

• 7-day fully functional free trial (no features restricted)

• One-time payment, lifetime license


🔹 IMPORTANT NOTES

• This indicator is designed to be applied directly to the Chart panel. Even if you select 'New Panel' in the properties, the indicator will still draw correctly on the chart.

• All times are in UTC. The indicator automatically handles day transitions and overnight sessions.

• After the 7-day trial expires, the indicator will stop working and display a message. Purchase the full version to continue using it.


⚠️ DISCLAIMER: Trading involves risk of loss. Past performance does not guarantee future results. This indicator is a visual tool designed to help traders identify market sessions. It does not generate trading signals. Always use proper risk management.


📧 SUPPORT: For questions, feature requests, or support, contact the developer through the cTrader Store.


Enjoy trading with Session & Kill Zone Highlighter!

Indicator profile
Indicator category
Volume
Output type
Visualisation
Data requirements
Bars only
5.0
Reviews: 1
5
100 %
4
0 %
3
0 %
2
0 %
1
0 %
Customer reviews
May 28, 2026
Supertrend
Key Levels
Liquidity Sweep
Volume
Market Structure
Liquidity Grab
Products available through cTrader Store, including trading bots, indicators and plugins, are provided by third-party developers and made available for informational and technical access purposes only. cTrader Store is not a broker and does not provide investment advice, personal recommendations or any guarantee of future performance.

More from this author

Indicator
Key Levels
Support & Resistance
Renko Multi-Level Grid Overlay draws configurable horizontal grid lines on any chart type, for multi-timeframe analysis.
Indicator
ADX
ATR
+5
Signal Quality Score - 0-100 filter combining RSI, Volume, ATR, Trend Strength & Alignment. Works on ANY chart type.
Indicator
ADX
ATR
+5
Identifies TRENDING, RANGING and VOLATILE markets with pullback detection. Anti-noise filter. Works on ANY chart.
Indicator
Market Structure
Support & Resistance
Auto-centers price when it moves beyond threshold. Adjustable zoom. Works on any chart type. Never lose price again.
cBot
Volume
Key Levels
Export OHLC data from any backtest to CSV. Works on Candles, Renko, Tick, Range. Perfect for external analysis.

You may also like

Indicator
ADX
ATR
+5
Lass System: Non-repainting M5 cTrader indicator with winrate dashboard & multi-asset alerts (Gold, BTC, EURUSD).
Indicator
Market Structure
Support & Resistance
Auto-centers price when it moves beyond threshold. Adjustable zoom. Works on any chart type. Never lose price again.
Indicator
ATR
RSI
+6
Market structural patterns , specifically the concepts of Change of Character (ChoCH) 🔄 and Break of Structure (BoS) 💥
Indicator
Forex
BTCUSD
+5
Buy-Side & Sell-Side Liquidity (BSL/SSL) Indicator
Indicator
Auto Fibonacci Retracement Indicator for cTrader
Indicator
AI
ATR
+20
Buy and Sell Signals
Indicator
Volume
Key Levels
+1
Tape Reading indicator ,book and flow analysis
Indicator
Highlights market sessions & overlaps with real-time range & volume stats – perfect for pro scalpers.
Indicator
Liquidity Grab
Liquidity Sweep
+1
CRT Sweep Tracker is an advanced panel for Candle Range Theory (CRT) traders to track HTF sweeps and manage live trades.
Indicator
Forex
EURUSD
+3
Forex Strength Meter for cTrader: 4 custom currencies, cross alerts, visual arrows. Trade smarter!
Indicator
Forex
BTCUSD
+10
Auto Supply and Demand Automatically identifies the zones of highest trading activity on your chart. 📊
Indicator
Forex
Crypto
+5
POC Order Blocks Pro: Alpha-Scored IOF Zones
Indicator
ATR
RSI
+11
This indicator puts three helpful trading tools on your chart at once. Think of it like having three expert traders
Indicator
Breakout
Break Out Probability Experimental indicator. Credits for this indicator goes to Zeiierman !!!
Indicator
Aggressive
Supertrend
+5
Stop trading with tunnel vision! 🚫 The Heat Map Dashboard is an institutional-grade visual trading assistant
Indicator
RSI
Signal
+1
Multi-timeframe version of the Quantitative Qualitative Estimation (QQE) indicator.
Indicator
Prop
Forex
+11
🌊 See when the market is truly in play. Tsunami measures Relative Volume by time-of-day 🌊
Indicator
Volume
Moving Average
Multi-Timeframe Rolling Volatility Indicator - Smart Volatility Breakout System
1
Sales
27
Free installs